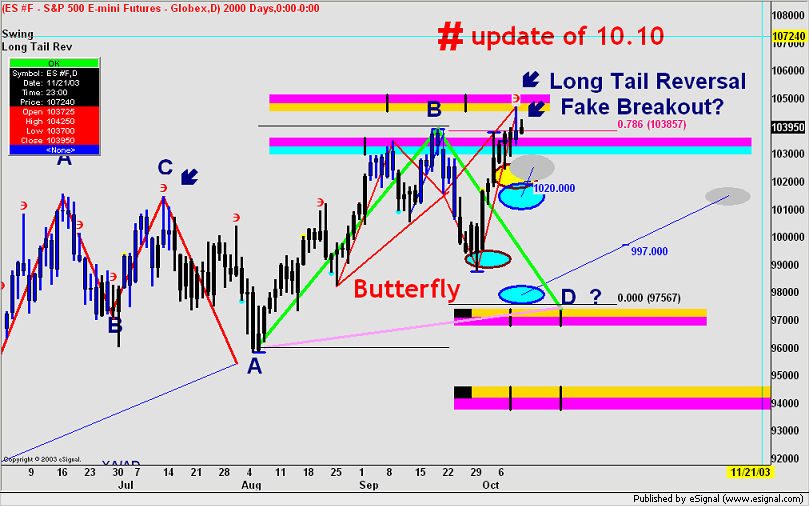
I agree, this could be a shorting oppurtunity. Square of 9 says price moved almost exactly 45 degrees , 988-1020, and the geometry looks good with the August cycle low .618 to Tuesday low and Sept 19 high to the high today. I was long last Friday @ 997 and exited today @ 1020 (the first spike up) . The only thing that bothers me is knowing Goldman is short gamma and the rest of the street is long it, which explains Wednesday's ramp (as well as an astro cycle).
Announcement
Collapse
No announcement yet.
Fibo & Geometry
Collapse
X
-
I am averaging into a short of 1035-1040 with a stop of 1041. It is based on the sqrt method for days, which ends today, and the astro signiture in the screenshot. There is also massive resistence @ 1040, which in ermanology terms is an Ezone, and will hold the short watching the time frame Oct 6-10. Oct 10 may be the top for the year.
Comment
-
I will exit for a 10 point gain to be flat for the weekend. To understand the astro and why it was significant (called a SuperTiming pattern) go to the link and get the Super Timing book. The screenshot shows the price levels I was looking at today.
Originally posted by theplumber
I am averaging into a short of 1035-1040 with a stop of 1041. It is based on the sqrt method for days, which ends today, and the astro signiture in the screenshot. There is also massive resistence @ 1040, which in ermanology terms is an Ezone, and will hold the short watching the time frame Oct 6-10. Oct 10 may be the top for the year.
http://homepages.ihug.co.nz/~ellsann/
Comment
-
I would thank plumber for the really great work he is doing, expecially in the above quoted PostOriginally posted by theplumber
I agree, this could be a shorting oppurtunity. Square of 9 says price moved almost exactly 45 degrees , 988-1020, and the geometry looks good with the August cycle low .618 to Tuesday low and Sept 19 high to the high today. I was long last Friday @ 997 and exited today @ 1020 (the first spike up) . The only thing that bothers me is knowing Goldman is short gamma and the rest of the street is long it, which explains Wednesday's ramp (as well as an astro cycle).Fabrizio L. Jorio Fili
Comment
-
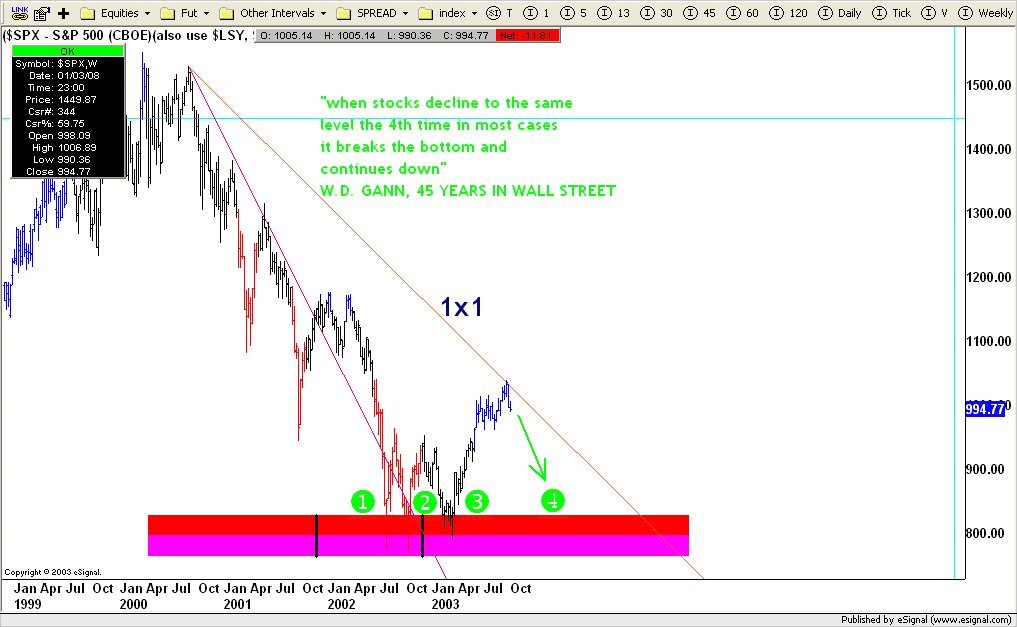
I disagree with you on this and I will explain why. What I do is not the commercial "Gann" or anything else, most who claim to be "Gann" experts only repeat what they read and don't trade. I use what Gann wrote in his books, Hurst cycle analysis, Chaos theory ( statistical mechanics/natural systems/ Ilya Prigogine's work) and my own education in number theory, or I can just say what ever makes me money. The Hurst cycle theory is very interesting as my charts will show. Most of all pay close attention to the phasing of the cycles. Based on my work (Gann said 50% of any decline will be the strongest support so 1552-775 is almost exactley 50%, and I use July 2002 low instead of Oct for a reason) the March 2003 lows of 789 will be very hard to break until well into 2006 at a minimum. The first chart is a weekly showing the cycles I have.
Originally posted by fabrizio
He said That....
 Last edited by theplumber; 10-04-2003, 08:31 AM.
Comment
-
So now your wondering what am I saying or am I just rambling. This on is all the cycles combined and the most interesting thing is the first cycle to make money on was July 4 cycle hit, this being a weekly cycle study it hit that week. The next is the week of 10/03/03, this past week. If you really study cycles ( the link below is a good reference) and know that major cycle lows are not always the lowest point then you will know why I am bullish until until now. Mid 2004 may be the top for this bull run but it will have the wind in it's face on it's way to 1116. http://homepages.ihug.co.nz/~ray.tomes/dewey.htmLast edited by theplumber; 10-04-2003, 10:18 AM.
Comment
-
I don't know how Esignal gets their Gann lines but the scaling looks off. The screenshot shows what my vendor says is 1X1 scaling, price to time. The zero lines are drawn from zero price directly below the dates of March 2000 and Sept 2000 and are 1X1 lines going up from there.
Originally posted by fabrizio
He said That....

Comment
-
This screen shot shows the Pesavento map, and for the first time in a long time it fits my cycles, maybe not in absolute price but direction more or less. I have Oct 10 as a turn date and a possible high the first week of December. If people saw the article in Barrons last week they saw the margin chart for Nasdaq, most of that is short. Add that fuel to the Fed thinking they can force reinvestment by companies through their stock price and the cycles make more sense to those who don't understand what I'm saying.
Comment
-
Plumber is Right since he is maybe using a different angleI don't know how Esignal gets their Gann lines but the scaling looks off. The screenshot shows what my vendor says is 1X1 scaling, price to time. The zero lines are drawn from zero price directly below the dates of March 2000 and Sept 2000 and are 1X1 lines going up from there.
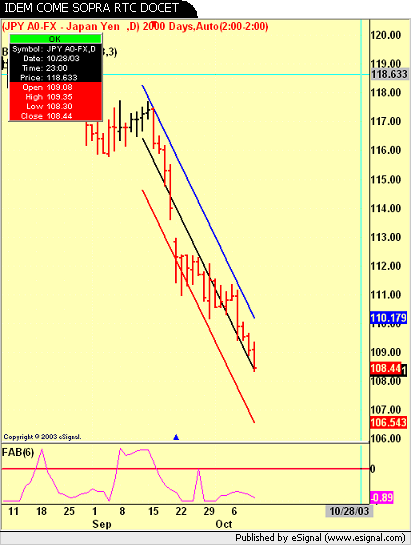
I consider the Sept Swing as the right one , since the whole movement started from there , actually after a 3 Drives at the top
This is my chart.

And here the other
 Last edited by fabrizio; 10-06-2003, 12:53 AM.Fabrizio L. Jorio Fili
Comment
-
Re: ? for Plumber
WaveOriginally posted by WAVETRADER1
Hello Plumber,
If you can, what cycles script or software are you using with esignal.
Many Thx,
Wavetrader
I personally draw manually my Pesavento's charts. I suppose that plumber do the same , though his chart is so properly done that I may suppose a sort of soft support.
I mean support, since there is not to my knowledge any soft mapping Pesavento.Fabrizio L. Jorio Fili
Comment

Comment