Announcement

Collapse
No announcement yet.

Advanced Charting Methods & Ideas

Collapse
X
 
  • Filter
  • Time
  • Show
Clear All
new posts

  • Advanced Charting Methods & Ideas

    This thread is for new users of eSignal to get familiar with the advanced charting possibilities and techniques for study of the markets and individual stocks. Interactive discussions of charting methods and creative uses for the myriad of charting tools available using this platform. Feel free to post your charts for discussion basic to extreme.

    Lets start with a weekly chart of the $INDU, This chart shows a comparison move of 1998. Study the rainbow effect created using multiple moving averages.

    http://share.esignal.com/groupconten...png&groupid=14

    Current Dow chart using daily....notice use of Fibonacci retracements

    http://share.esignal.com/groupconten...png&groupid=14

    Happy Charting<g>

    ~j
    Last edited by JJordan; 06-23-2003, 03:41 PM.

  • #2
    This chart employs the moving average envelope....the 3,-3ma signals when it crossed the 9ma. The 9,-9ma signals when it crosses the 3,-3ma. the "envelope" is created by offsetting or setting back a MA in this case the 3ma and 9ma

    signals:
    price cross 9ma signal
    price cross 40ma signal
    price converging on 200ma

    Buy signals:
    3,-3ma crosses price
    price crosses 9ma
    price cross 40ma signal
    3,-3ma crosses 9ma, then 40ma
    9ma crosses 40ma

    2hr chart
    Last edited by JJordan; 06-24-2003, 07:34 AM.

    Comment


    • #3
      2min. &quot;Envelope&quot;

      The Moving Average "Envelope"
      This is a 2min NDX chart showing the fibonacci retracement to 62% resistance,
      close attention to crossovers is required.
      Pay special attention to 40ma. That's the trend. These are useful tools.
      Look for a breakout or retracement at the harmonic. 70%


      Here is another chart example:

      KVHI_Daily

      Last edited by JJordan; 07-12-2003, 03:48 AM.

      Comment


      • #4
        Envelope charts

        Here is a continuation until the 40ma is broken an direction change is seen in the "enveloped channel.


        Look for strength or failure.

        Comment


        • #5
          End of a series

          Breaking the 40ma and fib. Recovery much harder now. Next fib target is 1.618 The market must show strength here.


          This is the last chart of this series...the day from 120 min. perspective. The market must mount something here.


          ...end
          Last edited by JJordan; 06-24-2003, 12:18 PM.

          Comment


          • #6
            Candles, Circles, Fibonacci

            Sounds like a Harry Potter novel? It's the Dow Daily chart.
            With the 13th Fed rate cut today the market gets to react.
            I say more retracement is needed, but.... Levels to watch: the 9ma and 40ma. I drew a line approx. 9250 an important bullish level.


            The MACD in in overbot levels watch for it to either go sideways...(bullish) or crossover. RSI is above 50....so watch

            Comment


            • #7
              Candlesticks

              Another Dow daily chart comparison using the Square of Nine formula. I have added my own lines on key candles. The market acts like it wants higher prior to rate cut? No thanks.

              Comment


              • #8
                Basic Chart

                A simple daily chart is useful intraday. I think this is a major top here? Watch the 40ma and the 200ma during the retracement. The MACD Histogram should confirm new trend.

                Comment


                • #9
                  SPX 10/40 ma Alerts

                  There is more than one way to get crossover signals.

                  Comment


                  • #10
                    Floating Charts

                    The Floating Charts feature is nice if you use multiple monitors and want to view charts outside the platform. Simply right clichk on chart select >view> float/dock window.

                    Comment


                    • #11
                      Daily Candles

                      Daily candles are helpful as they define trading ranges and show key points to watch. This was the set up Monday where the market moved higher nearly breaking out.


                      Then pulled back but still closed above the high of previous low candle.


                      Last edited by JJordan; 07-15-2003, 06:19 AM.

                      Comment


                      • #12
                        Jordan

                        As lready said IMHO you are a hell of a chartist.
                        I like your posts
                        Despite many others are short.
                        Too much!

                        What I mean is: give just a "short note map" of your path.(what in rally car races is calle d RADAR (and the or the coequipier Notes)

                        ..Not too much but just:
                        *Where are we
                        *Where we wanna go
                        *How and how fast
                        *In much Time and when we check the results
                        *Which outcome do we excpect

                        Agai ìf someone do not know Murray M. lines you can't spend Hrs to explain. But You can indicate and trace the "route"

                        Peiod

                        Thanks

                        Fabrizio
                        Fabrizio L. Jorio Fili

                        Comment


                        • #13
                          Consolidation or Speculation?

                          Hi Fab,

                          I think the gas tank is full of vapor? I wish I understood, sq. of 9 and those other astronomical mathematica theories?

                          Thanks for the comments.

                          ~j

                          Comment


                          • #14
                            Re: Consolidation or Speculation?

                            Originally posted by JJordan
                            [B]Hi Fab,

                            I think the gas tank is full of vapor? I wish I understood, sq. of 9 and those other astronomical mathematica theories?

                            Thanks for the comments.
                            Hi JJ

                            Again , I like your charts and your perspective.You are really good

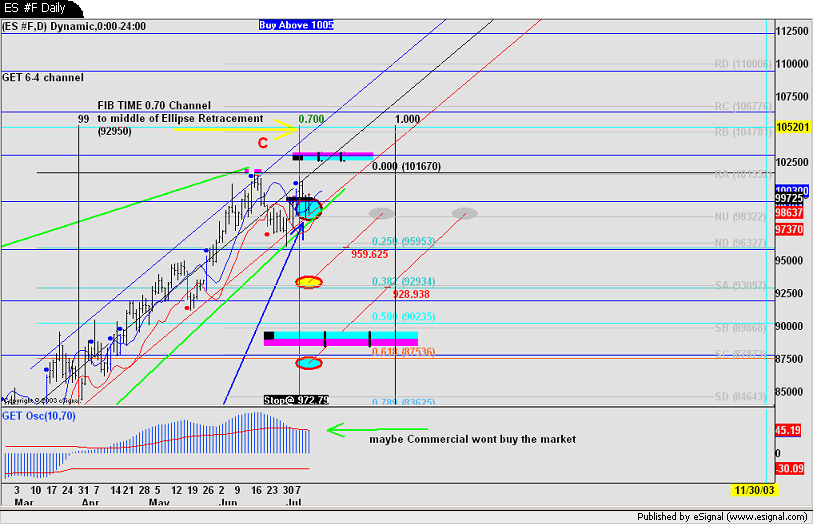
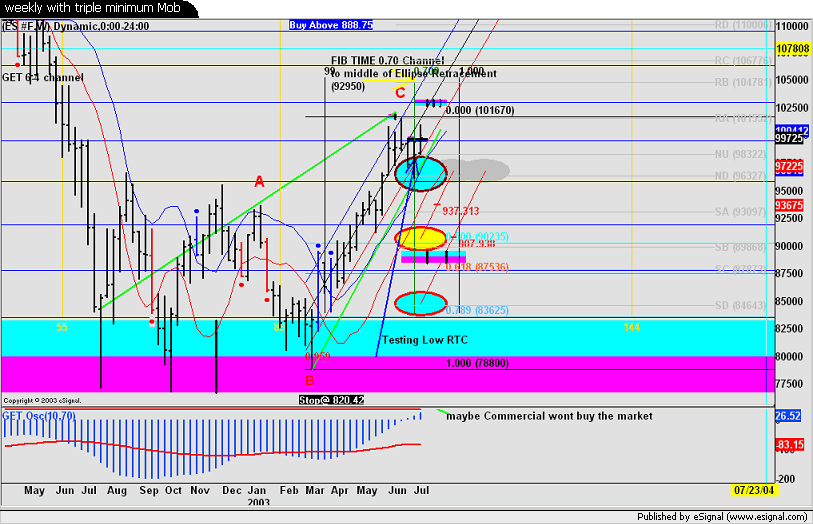
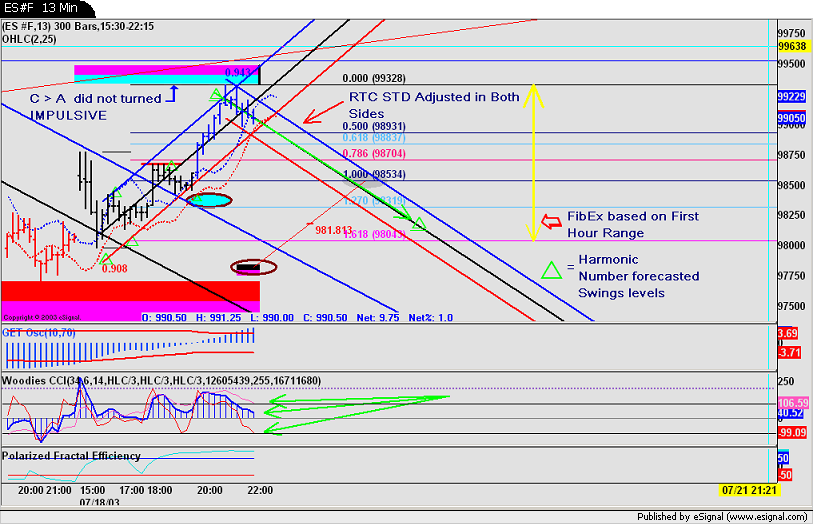
                            A) about your chart , you pointed out: on the border , just 1" and then finally down. Did you took a look to the MP at 20.10 CET on the ESP? . IMHO we will follow the downtrend channel i posted in the aget forum.


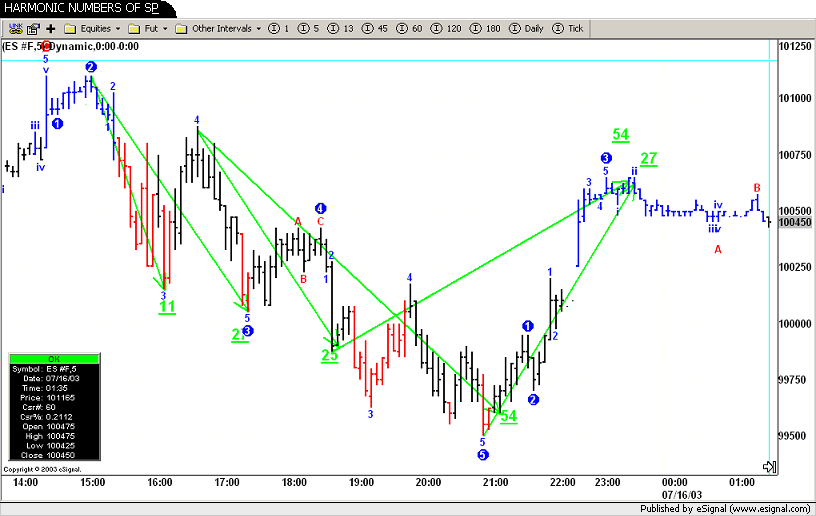
                            We got a triple maximum, we got a nice mob thee up that stopped the rise. down there there was a triple minimum and.......to be esotheric Harmonic number gives a strong chanche that yestreday new day high should have been followed by a strong swing ( take this figure 540, and use it the manner you prefer: 54.0 ; 5.40
                            .....)


                            b) second part of you post: do you refere to this post of mine?

                            Fabrizio L. Jorio Fili

                            Comment


                            • #15
                              JJ

                              Got a matches?

                              Fabrizio L. Jorio Fili

                              Comment

                              Working...
                              X