 Tweet
Tweet
I am new to developing any sort of backtesting formula but over the last few weeks I have been working on a strategy. I have got the code to work fine however in some instances I noticed that the code missed some entry signals.
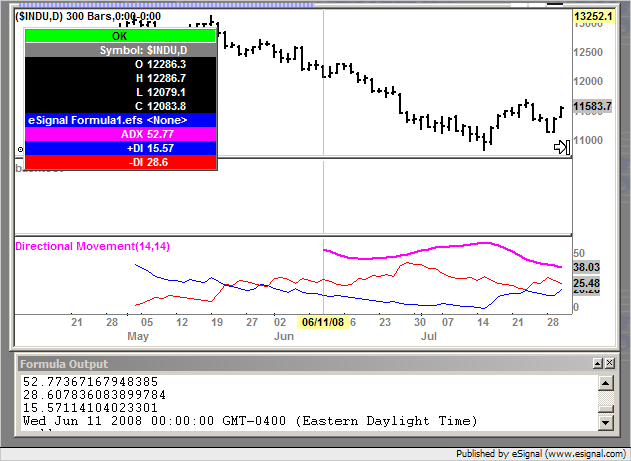
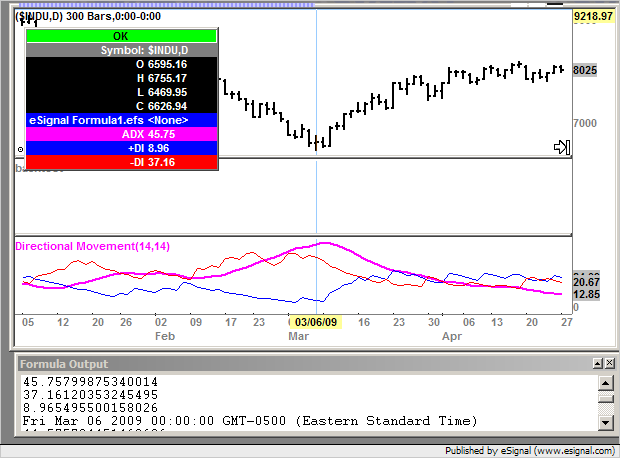
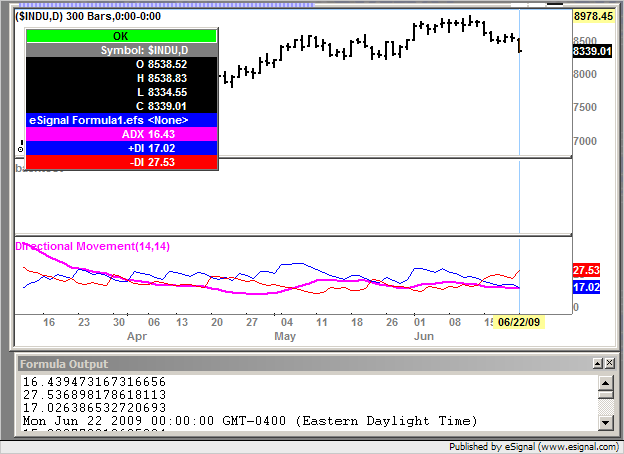
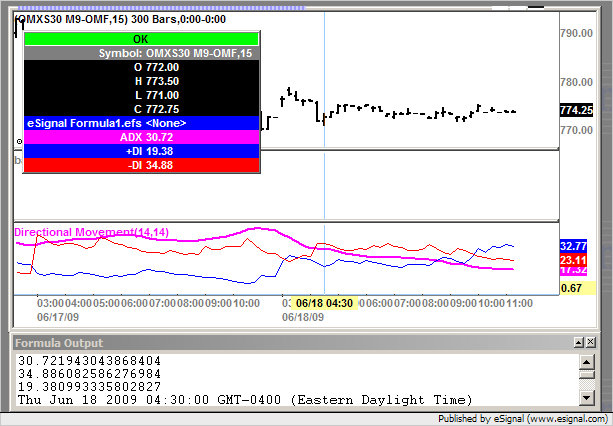
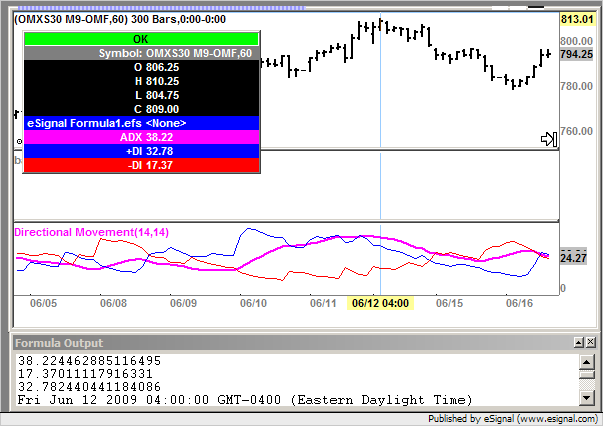
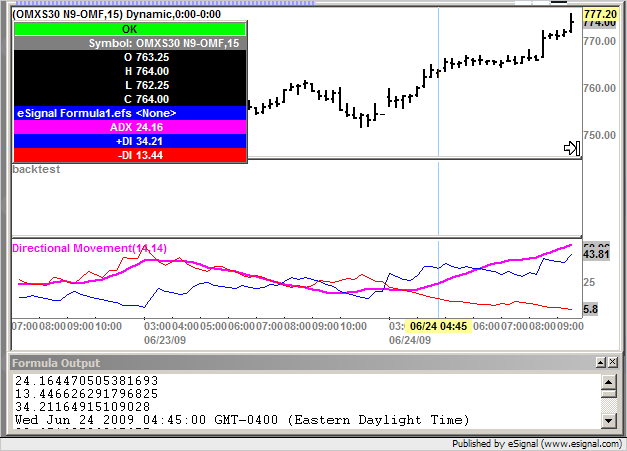
After a long period of checking and re-checking my trade entry code I ran a 'debugPrintln' command for 3 of the most important variables in my strategy. They come from the ADXDMStudy (14,14). The numbers it generated never matched those generated by the same study (with the same parameters) on a chart. This situation was repeated no matter what product I ran the formula on. Therefore, although it picked up the majority of the signals because the underlying trend of the data was the same, some it did not.
Is this a known issue with data derived from studies when using EFS formulae? or perhaps just for this particular study? If so it makes the whole thing relatively pointless for determining actual trading points. How can you get around this?
This is the code I have used (cut from the main code) to extract the relevant data points. If you bring up a chart and add the ADXDMStudy(14,14) to the chart you will see that the numbers produced are always different. Can anybody tell me why this is? Many thanks in advance.
var vADXDM = null;
function preMain() {
setPriceStudy(false);
setStudyTitle("backtest");
}
function main()
{
if (vADXDM == null) vADXDM = new ADXDMStudy(14, 14);
if (vATR20 == null || vADXDM == null)
return;
if (open() > 1){
debugPrintln(getValue("time"));
debugPrintln( vADXDM.getValue(ADXDMStudy.PDI));
debugPrintln( vADXDM.getValue(ADXDMStudy.NDI));
debugPrintln( vADXDM.getValue(ADXDMStudy.ADX));
}}
Comment