Announcement

Collapse
No announcement yet.

Different Values generated: EFS Vs Chart

Collapse
X
 
  • Filter
  • Time
  • Show
Clear All
new posts

  • Different Values generated: EFS Vs Chart

    I am new to developing any sort of backtesting formula but over the last few weeks I have been working on a strategy. I have got the code to work fine however in some instances I noticed that the code missed some entry signals.

    After a long period of checking and re-checking my trade entry code I ran a 'debugPrintln' command for 3 of the most important variables in my strategy. They come from the ADXDMStudy (14,14). The numbers it generated never matched those generated by the same study (with the same parameters) on a chart. This situation was repeated no matter what product I ran the formula on. Therefore, although it picked up the majority of the signals because the underlying trend of the data was the same, some it did not.

    Is this a known issue with data derived from studies when using EFS formulae? or perhaps just for this particular study? If so it makes the whole thing relatively pointless for determining actual trading points. How can you get around this?

    This is the code I have used (cut from the main code) to extract the relevant data points. If you bring up a chart and add the ADXDMStudy(14,14) to the chart you will see that the numbers produced are always different. Can anybody tell me why this is? Many thanks in advance.

    var vADXDM = null;

    function preMain() {
    setPriceStudy(false);
    setStudyTitle("backtest");
    }

    function main()
    {

    if (vADXDM == null) vADXDM = new ADXDMStudy(14, 14);


    if (vATR20 == null || vADXDM == null)
    return;

    if (open() > 1){
    debugPrintln(getValue("time"));
    debugPrintln( vADXDM.getValue(ADXDMStudy.PDI));
    debugPrintln( vADXDM.getValue(ADXDMStudy.NDI));
    debugPrintln( vADXDM.getValue(ADXDMStudy.ADX));
    }}
  • #2
    Re: Different Values generated: EFS Vs Chart

    naples99
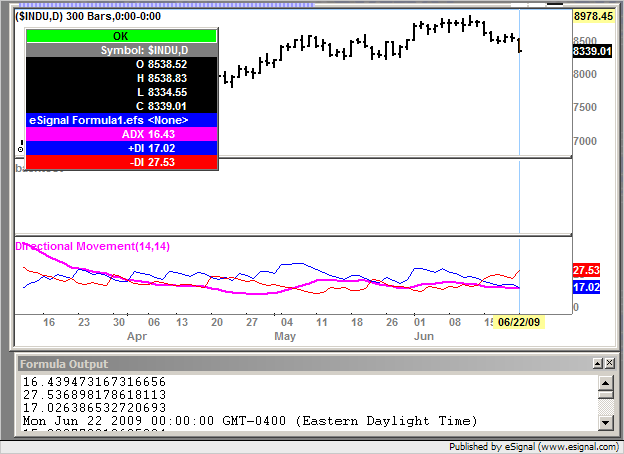
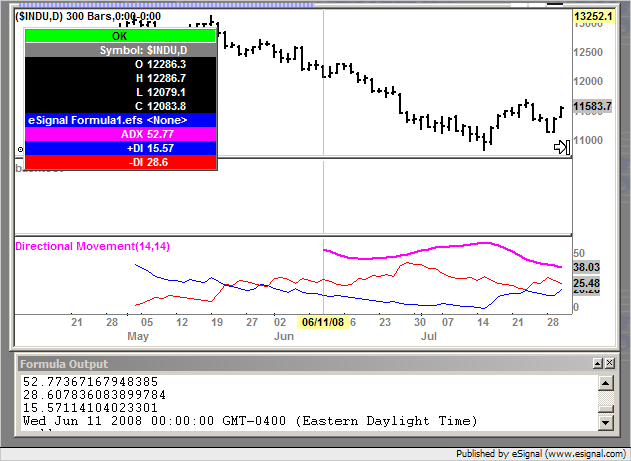
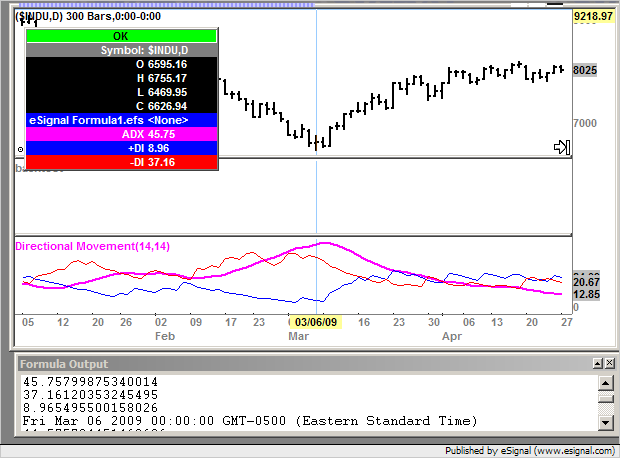
    I just ran your script and compared its output to that of the ADXDMStudy in Basic Studies and the values appear to match. The three screenshots enclosed below show the values at the first bar in which all three values are returned, some random point in the chart and the current bar [also other points in the middle of the chart were tested and appeared to have matching values]
    You may want to provide more details as to the symbol, interval, etc in which they are not matching at your end so that someone else can try to replicate the same conditions
    Alex


    Originally posted by naples99
    I am new to developing any sort of backtesting formula but over the last few weeks I have been working on a strategy. I have got the code to work fine however in some instances I noticed that the code missed some entry signals.

    After a long period of checking and re-checking my trade entry code I ran a 'debugPrintln' command for 3 of the most important variables in my strategy. They come from the ADXDMStudy (14,14). The numbers it generated never matched those generated by the same study (with the same parameters) on a chart. This situation was repeated no matter what product I ran the formula on. Therefore, although it picked up the majority of the signals because the underlying trend of the data was the same, some it did not.

    Is this a known issue with data derived from studies when using EFS formulae? or perhaps just for this particular study? If so it makes the whole thing relatively pointless for determining actual trading points. How can you get around this?

    This is the code I have used (cut from the main code) to extract the relevant data points. If you bring up a chart and add the ADXDMStudy(14,14) to the chart you will see that the numbers produced are always different. Can anybody tell me why this is? Many thanks in advance.

    var vADXDM = null;

    function preMain() {
    setPriceStudy(false);
    setStudyTitle("backtest");
    }

    function main()
    {

    if (vADXDM == null) vADXDM = new ADXDMStudy(14, 14);


    if (vATR20 == null || vADXDM == null)
    return;

    if (open() > 1){
    debugPrintln(getValue("time"));
    debugPrintln( vADXDM.getValue(ADXDMStudy.PDI));
    debugPrintln( vADXDM.getValue(ADXDMStudy.NDI));
    debugPrintln( vADXDM.getValue(ADXDMStudy.ADX));
    }}
    Comment


    • #3
      Thanks for your very prompt reply, it's much appreciated.

      You're right, I wasn't clear enough (or even at all) about the intervals I am using/trying to use. When I ran my script on the same chart as you have (on the screenshots you sent over) at the same interval I too got the data to match. However my issue is with intraday periods, specificaly 15 and 60 min intervals. The primary symbols I am looking at are OMXS30 N9-OMF (but as this has just rolled over and esignal doesn;t do a continuous series for this symbol it is better to bring up the now expired OMXS30 M9-OMF) and AX U9-DT (again possibly better to look at expired AX -M9-DT for demonstration purposes).

      I have just run the same script to make sure I'm not being a complete idiot and still get mis-matches. Please can you look at this again for me at these shorter intervals.

      Thanks again

      Comment


      • #4
        naples99
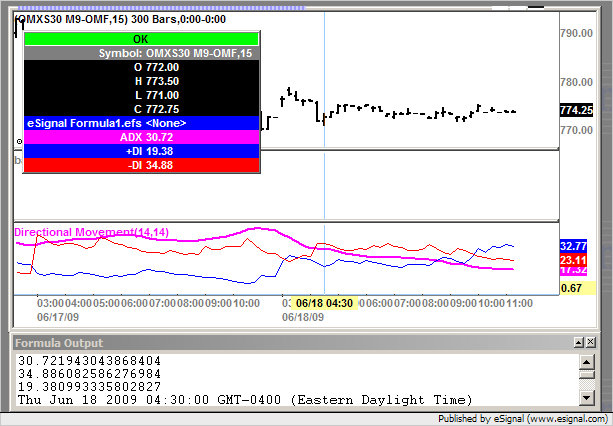
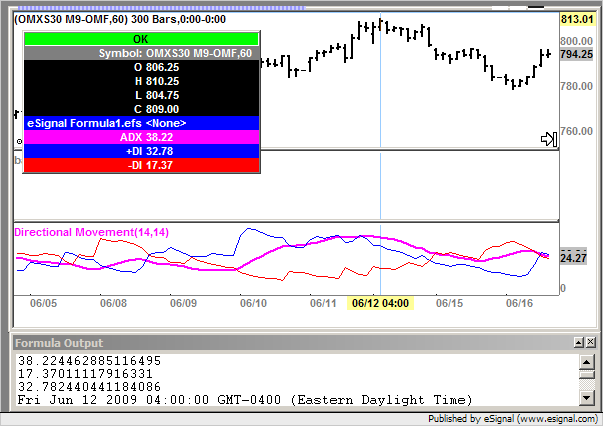
        Here are two more images of a 15 and 60 minute chart of OMXS30 M9-OMF
        Also in this case the values appear to match
        Alex


        Originally posted by naples99
        Thanks for your very prompt reply, it's much appreciated.

        You're right, I wasn't clear enough (or even at all) about the intervals I am using/trying to use. When I ran my script on the same chart as you have (on the screenshots you sent over) at the same interval I too got the data to match. However my issue is with intraday periods, specificaly 15 and 60 min intervals. The primary symbols I am looking at are OMXS30 N9-OMF (but as this has just rolled over and esignal doesn;t do a continuous series for this symbol it is better to bring up the now expired OMXS30 M9-OMF) and AX U9-DT (again possibly better to look at expired AX -M9-DT for demonstration purposes).

        I have just run the same script to make sure I'm not being a complete idiot and still get mis-matches. Please can you look at this again for me at these shorter intervals.

        Thanks again

        Comment


        • #5
          I'm still getting different values. How have you attached the charts below?

          Comment


          • #6
            OK, since I can't work out a way of attaching the formula output (the file is always too large) all I can do is type the numbers - it won't even let me cut and paste the relevant numbers - nand attach the chart. Note I'm in the UK so the time stamp is different and they are in the same order as the script already run below.

            31.98975942846664
            33.85884824725681
            16.417724648651085
            Thu Jun 18 2009 09:30:00 GMT+0100 (GMT Standard Time)

            Note that as well as being different from each other they are also different from the data you obtained. I've checked and I'm definitely using the same parameters i.e. ADXDMStudy(14,14)

            Thanks again
            Attached Files

            Comment


            • #7
              Apologies, chart too small on last post.....
              Attached Files

              Comment


              • #8
                and here is a more dramatic difference

                Formula output:

                19.734248573199014
                13.871445992500423
                29.92485365003756
                Wed Jun 24 2009 09:45:00 GMT+0100 (GMT Standard Time)
                Attached Files

                Comment


                • #9
                  naples99
                  So far I am unable to replicate the issue you are seeing.
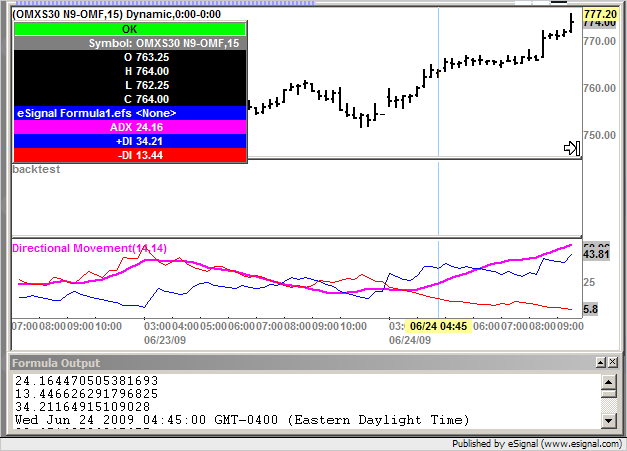
                  Enclosed is a snapshot replicating the last one you posted (using same symbol, Time Template etc) and the output of the efs matches that of the Basic Study ADXDM which in turn matches the values shown by the Basic Study ADXDM plotted in your image

                  Note that as well as being different from each other they are also different from the data you obtained. I've checked and I'm definitely using the same parameters i.e. ADXDMStudy(14,14)
                  With regards to this issue keep in mind that they would not match unless your chart started on the same bar as mine which it more than likely did not since you were using a different Time Template than the one used by me.
                  Due to the nature of the calculations used in the ADX study the values will always differ [up to a certain point] unless you start on the same exact bar. This is because Wilder's smoothing method [which is used in the ADX study] keeps all the historical values in its calculations
                  If you were to apply the same Time Template and adjust for the difference in additional days elapsed from the time I posted that image then you would likely end up with the same values as the ones shown in my image
                  Alex


                  Originally posted by naples99
                  and here is a more dramatic difference

                  Formula output:

                  19.734248573199014
                  13.871445992500423
                  29.92485365003756
                  Wed Jun 24 2009 09:45:00 GMT+0100 (GMT Standard Time)

                  Comment


                  • #10
                    Ah , thank you. This seems to have been my problem. I had assumed that the backtesting tool looked at all the data but only produced trades/results for the period specified by the user and that therefore the data they look at should be the same. When I set the chart and do the backtest on the same lenth of time/number of bars then I also get it to match. So far, so good.

                    Thank you very much for looking at this for me, your input has been a great help.

                    Comment


                    • #11
                      naples99
                      You are most welcome
                      Alex


                      Originally posted by naples99
                      Ah , thank you. This seems to have been my problem. I had assumed that the backtesting tool looked at all the data but only produced trades/results for the period specified by the user and that therefore the data they look at should be the same. When I set the chart and do the backtest on the same lenth of time/number of bars then I also get it to match. So far, so good.

                      Thank you very much for looking at this for me, your input has been a great help.

                      Comment

                      Working...
                      X