Announcement

Collapse
No announcement yet.

HELP! EFS Strategy with offset MA's

Collapse
X
 
  • Filter
  • Time
  • Show
Clear All
new posts

  • HELP! EFS Strategy with offset MA's

    All,

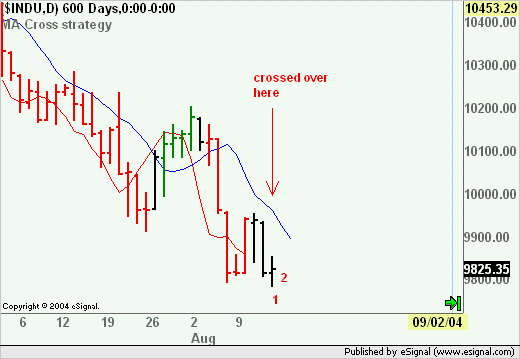
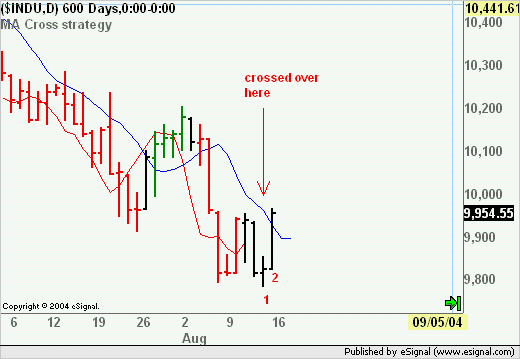
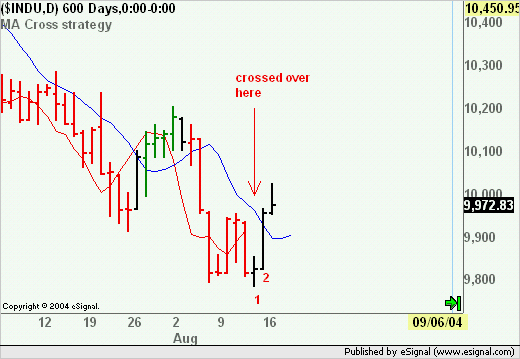
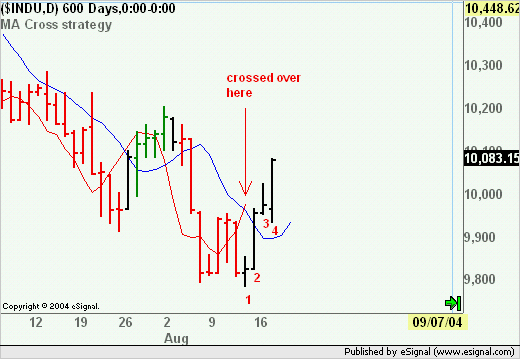
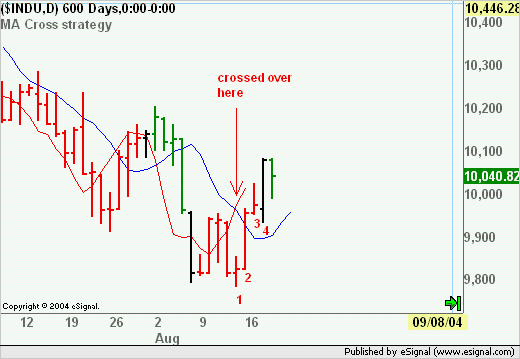
    I have developed an efs strategy and have attached it to this. In the strategy I use to MA's both offset. One is offset -3 the other +2.

    When I run it through the backtester I get great results. When I use it during a live trading day my offset -3 returns null and it seems that my offset +2 returns the MA value of the current bar not the +2 displaced value.

    Why does this work in the backtester and not on live data?


    Thanks,


    Jon
    Attached Files

  • #2
    Jon,

    I think a negative offset would be looking into the future (with MAStudy), so it would make sence that it would backtest well (too well!) but fail in realtime. I would expect that you get null returns for your last 3 bars when running in backtest mode if my guess is correct.

    Not sure why +2 offset isn't working. Are you comparing it to a weighted MA on the chart?

    Garth
    Garth

    Comment


    • #3
      Jon
      Following to Garth's comments here is why the efs is returning great results in back test.
      In the first image you can see that in addition to your efs I am also plotting the two WMA (10 offset 2 in blue and 5 offset -3 in red). On the bar indicated by the arrow the 5,-3wma crosses over the 10,2wma and in fact the strategy covers the short (bar 1). On the next bar (bar 2) the strategy goes long at the Open at 9825.35.


      However what was the situation at that time ie was a signal to go long actually triggered at bar 1?
      Using Bar Replay we can go back in time and as you will see the averages are far from signalling a crossover. The reason why you instead get a signal in back testing is because - as Garth said - the strategy knows in advance what the values will be three bars ahead.


      So when does the signal actually get triggered in real time? Again using Bar Replay we can go forward one bar at a time. Following is the sequence


      And finally on the following bar we have the averages crossing over.


      The strategy will now cover the short (remember that the strategy is still short on bars 1, 2,3 and 4) and will go long at the Open of the next bar (which is not shown in the chart) The entry value will be 10082.78 which is considerably different from the 9825.35 shown in back testing.

      If you want to see in back testing how the same efs would actually perform in real time then replace lines 12 and 13 with the following

      var MA1 = study1.getValue(MAStudy.MA,-3);
      var MA2 = study2.getValue(MAStudy.MA,-3);

      This will set the efs to look back three bars (ie the negative offset) to find the crossover conditions because there are no returned values for the 5,-3wma before bar index -3.

      In the following image you will see that the bars are now colored in a different way which reflects the real time conditions.


      Run the revised efs through the back tester and the results also should be quite different.
      Hope this helps
      Alex

      Comment

      Working...
      X