Announcement

Collapse
No announcement yet.

Max Drawdown error?

Collapse
X
 
  • Filter
  • Time
  • Show
Clear All
new posts

  • Max Drawdown error?

    I use the Strategy Analyzer extensively in developing my trading systems. One thing I just noticed while working on a new one is that it appears that the "Max Strategy Drawdown" reported on the main page is not correct.


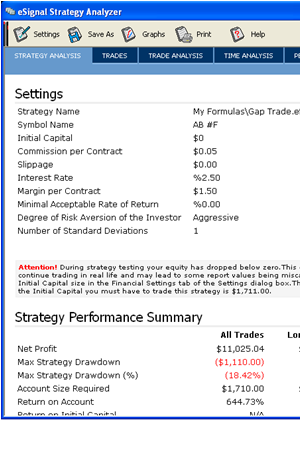
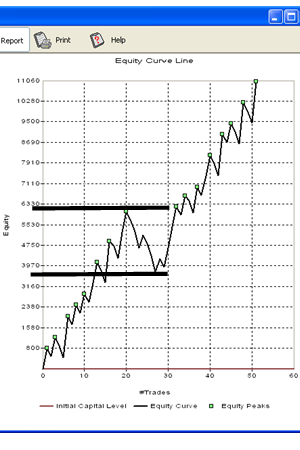
    This shows a max drawdown of $1,110 but the equity graph clearly shows a drawdown of over $2,000


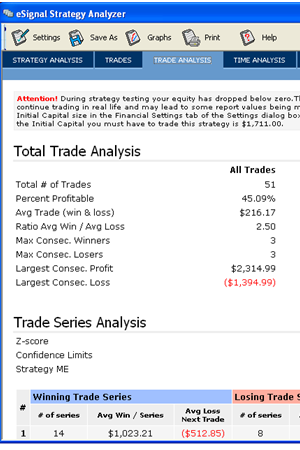
    Even the largest consecutive loss is reported as larger than the maximum drawdown


    What's up with this?
    Last edited by ebr; 01-27-2005, 03:17 PM.

  • #2
    Hello ebr,

    I'm not certain how the Strategy Analyzer is calculating that field. I just sent an inquiry to our development team and they will be investigating this issue. I'll post a follow-up when we know more.
    Jason K.
    Project Manager
    eSignal - an Interactive Data company

    EFS KnowledgeBase
    JavaScript for EFS Video Series
    EFS Beginner Tutorial Series
    EFS Glossary
    Custom EFS Development Policy

    New User Orientation

    Comment


    • #3
      Okay, thanks Jason.

      The description of the field is as follows:

      "The largest equity dip that took place during the test period. The largest equity dip is the difference between an equity high and a subsequent equity low."

      Therefore, I would conclude the logic to calculate that value would be something like this:
      • keep track of last equity high
      • when a new equity high is reached look at all the equity values between this high and the last high. the lowest of which is the equity low for that portion of the test period.
      • drawdown is now computed as the difference between the last equity high and that equity low
      • compare that to the largest drawdown so far and replace it if this one is larger
      • rinse, repeat


      There may be other/better logic than that, but something along those lines will give you what the field description says it is. In any case, it doesn't make any sense at all for the "Max Strategy Drawdown" to be smaller than the "Largest consecutive loss".

      Hopefully, this is some sort of isolated bug related to something I'm doing wrong but let us know what you find out.

      Comment


      • #4
        Hello again ebr,

        I've been noticing this wierdness for over a year now as well. Looks like we're both paddling the same boat. The Detailed Equity Curve is a very strange beast too. Do you agree? In my case, the Strategy Analyzer shows drawdowns vastly exceeding anything shown on the Equity Curve. It's as if the drawdown they're showing is the total of ALL the dips on the curve. I have yet to take the time and do a trade by trade calculation / verification myself, but I will at some point. I wonder if Trade Station has subtle anomalies like this?

        I tend to ignore the Max Drawdown number in the generated report. As part of my system, I'm now tracking P&L, and as a result I have a "quick & dirty" little back tester built into the system which gives the same results as the eSignal tester in regards to total profit, win/loss ratios, etc. However, when running on the AB and MC symbols, there are very slight discrepencies due to the rounding/precision errors we're discussing elsewhere.

        For the AB I'd suggest you use $10 for commission, and $15 for the slippage; unless you enter with limit orders and can verify the fill within your strategy code. That slippage number allows for a one tick slip on entry with a 3 lot; 50% of the time. It should probably be even bigger so you don't get too elated with the backtest results you're getting. BTW, they really look great without the slippage.

        Take care,
        __
        JO
        Last edited by TraderJO; 01-27-2005, 05:49 PM.

        Comment


        • #5
          Jason - has there been any response on this issue?

          Thanks.

          Comment


          • #6
            Hello ebr,

            An inquiry was forwarded to the developer of the tool, but I have not received an explanation behind the calculation. I was informed that development is planning to revamp this tool for 8.0, so hopefully the calculation will get a second look during that process. I've sent a follow up on the topic again today.
            Jason K.
            Project Manager
            eSignal - an Interactive Data company

            EFS KnowledgeBase
            JavaScript for EFS Video Series
            EFS Beginner Tutorial Series
            EFS Glossary
            Custom EFS Development Policy

            New User Orientation

            Comment


            • #7
              Okay. Thanks.

              Just post here when you hear something.

              Comment

              Working...
              X