 Tweet
Tweet
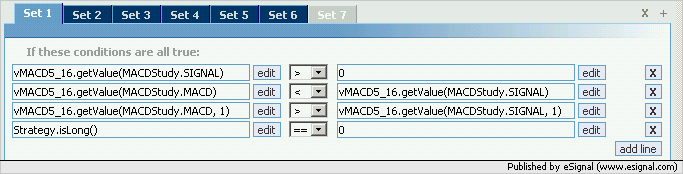
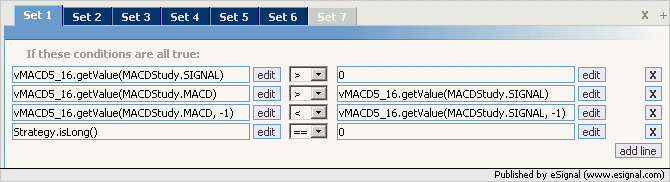
All it is, is a simple MACD (6,16,27) crossover. A buy signal is when the MACD fast crosses above the MACD slow. An exit is the opposite and also triggers a reversal entry. Below are some screenshots from Esignal with results from 04/06/28-05/03/31. Using a 400Tick Timeframe.
I also set the backtest to simulate each entry and exit to be off by 2 ticks on the Russell 2000, to try to simulate a poor entry on each trade.
The system seems too simple to produce these results? Am I missing something here? Any help would be great!


I also set the backtest to simulate each entry and exit to be off by 2 ticks on the Russell 2000, to try to simulate a poor entry on each trade.
The system seems too simple to produce these results? Am I missing something here? Any help would be great!
Comment