 Tweet
Tweet
I hv written below EFS based on MA crossover. One of the line will change color (long: orange, short: red, white: no position). However, after adding a few rows for backtesting (Strategy.xxx), the line is not showing the correct result again.
The problem happens for row 61/62. The strange thing is that it displays wrong color for Strategy.isInTrade(). However, if I change it to Strategy.isShort(), the color is correct. So what is wrong?
- correct display for Strategy.isShort()
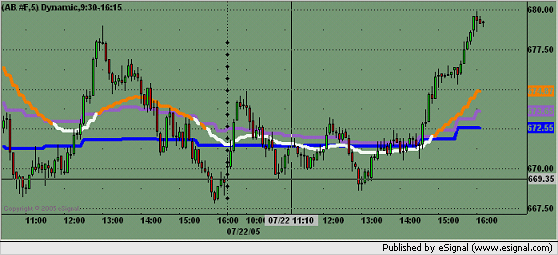
- wrong display for Strategy.isLong() or Strategy.isInTrade()

- EFS
var EMA_Interval_0 = 10;
var EMA_Interval_1 = 30;
var EMA_Interval_2 = 60;
var nMALength = 20;
var OverallTrend = "No Trend";
var EMA0FgColor = Color.grey;
function preMain()
{
var x=0;
setPriceStudy(true);
setStudyTitle("System backtest");
setCursorLabelName("EMA2",0);
setDefaultBarThickness(4,0);
setDefaultBarFgColor(Color.blue,0);
setCursorLabelName("EMA1",1);
setDefaultBarThickness(4,1);
setDefaultBarFgColor(Color.purple,1);
setCursorLabelName("EMA0",2);
setDefaultBarThickness(4,2);
setDefaultBarFgColor(Color.cyan,2);
setComputeOnClose(true);
}
function main()
{
vEMA0 = ema(nMALength, inv(EMA_Interval_0));
vEMA1 = ema(nMALength, inv(EMA_Interval_1));
vEMA2 = ema(nMALength, inv(EMA_Interval_2));
if ( vEMA0==null || vEMA1==null || vEMA2==null ) return;
OverallTrend_previous=OverallTrend;
if ( vEMA0>vEMA1 && vEMA1>vEMA2 )
OverallTrend = "Up";
else if ( vEMA0<vEMA1 && vEMA1<vEMA2 )
OverallTrend = "down";
else
OverallTrend = "No Trend";
switch (OverallTrend) {
case "Up":
EMA0FgColor = Color.RGB(255,128,0);
if ( !Strategy.isInTrade() ) {
Strategy.doLong("Long",Strategy.MARKET,Strategy.NE XTBAR);
}
break;
case "Down":
EMA0FgColor = Color.magenta;
if ( !Strategy.isInTrade() )
Strategy.doShort("Short",Strategy.MARKET,Strategy. NEXTBAR);
break;
case "No Trend":
EMA0FgColor = Color.white;
if ( Strategy.isInTrade() ) {
Strategy.doCover("Exit", Strategy.MARKET, Strategy.NEXTBAR, Strategy.ALL);
}
break;
default:
}
setDefaultBarFgColor(EMA0FgColor,2);
return new Array (vEMA2, vEMA1, vEMA0);
}
The problem happens for row 61/62. The strange thing is that it displays wrong color for Strategy.isInTrade(). However, if I change it to Strategy.isShort(), the color is correct. So what is wrong?
- correct display for Strategy.isShort()
- wrong display for Strategy.isLong() or Strategy.isInTrade()
- EFS
var EMA_Interval_0 = 10;
var EMA_Interval_1 = 30;
var EMA_Interval_2 = 60;
var nMALength = 20;
var OverallTrend = "No Trend";
var EMA0FgColor = Color.grey;
function preMain()
{
var x=0;
setPriceStudy(true);
setStudyTitle("System backtest");
setCursorLabelName("EMA2",0);
setDefaultBarThickness(4,0);
setDefaultBarFgColor(Color.blue,0);
setCursorLabelName("EMA1",1);
setDefaultBarThickness(4,1);
setDefaultBarFgColor(Color.purple,1);
setCursorLabelName("EMA0",2);
setDefaultBarThickness(4,2);
setDefaultBarFgColor(Color.cyan,2);
setComputeOnClose(true);
}
function main()
{
vEMA0 = ema(nMALength, inv(EMA_Interval_0));
vEMA1 = ema(nMALength, inv(EMA_Interval_1));
vEMA2 = ema(nMALength, inv(EMA_Interval_2));
if ( vEMA0==null || vEMA1==null || vEMA2==null ) return;
OverallTrend_previous=OverallTrend;
if ( vEMA0>vEMA1 && vEMA1>vEMA2 )
OverallTrend = "Up";
else if ( vEMA0<vEMA1 && vEMA1<vEMA2 )
OverallTrend = "down";
else
OverallTrend = "No Trend";
switch (OverallTrend) {
case "Up":
EMA0FgColor = Color.RGB(255,128,0);
if ( !Strategy.isInTrade() ) {
Strategy.doLong("Long",Strategy.MARKET,Strategy.NE XTBAR);
}
break;
case "Down":
EMA0FgColor = Color.magenta;
if ( !Strategy.isInTrade() )
Strategy.doShort("Short",Strategy.MARKET,Strategy. NEXTBAR);
break;
case "No Trend":
EMA0FgColor = Color.white;
if ( Strategy.isInTrade() ) {
Strategy.doCover("Exit", Strategy.MARKET, Strategy.NEXTBAR, Strategy.ALL);
}
break;
default:
}
setDefaultBarFgColor(EMA0FgColor,2);
return new Array (vEMA2, vEMA1, vEMA0);
}
Comment