 Tweet
Tweet
All,
Firstly, can I say that I appreciate all those who have been helping the new users on this forum. I’ve been attempting to develop backtest scripts now for a couple of months, and without these forums I would be extremely lost.
Secondly, I have attached my first script there. I would greatly appreciate if one of the more advanced users on the forum could take some time to give it a peer review? Of course, I’m happy for the feedback to be posted to the forum so that any other newcomers could benefit from the feedback I receive.
The strategy description is as follows: It is focused on intra-day trading, looking at price excursion away from the morning session day high / low. It is designed to be the basis for trading the afternoon session of the NYSE (New York Stock Exchange) based on the morning session high / lows. Once the price has moved outside of the day high / low, it then looks for the first move back towards that range (i.e. if the price is now above the morning high, the strategy looks to enter after the first negative bar back towards the day range).
Unfortunately, from early back tests the strategy is flawed. However, I think much of the code contained within might be reuseable. For example, the entry & exit code with minor adjustments. In the end coding the strategy become a learning exercise.
Some key points of note:
• I have been running this script consistency against HPQ (NYSE) over the last couple of months while I’ve been developing it
• The backtest should be run on a 5 min bar chart – I’ve personally been using candlestick charts though I don’t think it matters if it is a standard bar chart
• I have been using standard settings in the strategy analyser (i.e. 100 contracts / shares, 0 commission / slippage, etc)
Two of the areas that I’ve had a challenge with while building the script were:
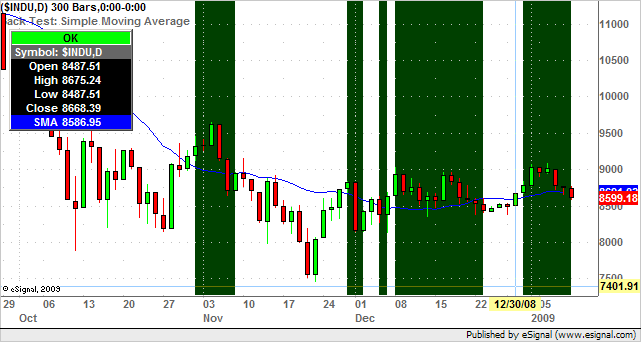
Background colouring
I can’t seem to get the background to colour appropriately. I’m to understand from reading the forums that this is not working in this build version of Esignal. However, I have also tried colouring the bars themselves to mark entry points, this doesn’t seem to be working either. I’m a little confused how the chart is updated while it is static. That is, when using a chart for backtesting purposes it appears to me to be necessary to load all the necessary data (in this case it is intra-day 5 min bars up to 120 days). Only then will the backtest run across all that data. I’m a little confused on how Esignal updates that static chart when running a backtest? Is the background & bar colouring functionality only aimed at playback and real time strategy analysis?
Exits / drawdown
I’ve found challenging is reconciling the stop-loss exits with the drawdown numbers reported in the strategy analyser. For example, if you run this script against HPQ you will find trades on the 30/04/08 and 01/05/08 (N.B. dates in European format). In each of those traded you will note that the maximum drawdown on each of those trades is drawdown which is significantly over and above the stop loss points in the strategy. However, the actual reported exit point is correct. This is worrisome; I think what is happening is that the Strategy Analyser is reporting that the position is open all the way through the bar, but then closing out the position when bar closes – but reporting that the trade is being held all throughout the development of the bar, when it should be reporting the position as closed when the stop kicks in.
Any help or guidance more experienced members of the forum could offer would be greatly appreciated.
Kind regards,
Dan
Firstly, can I say that I appreciate all those who have been helping the new users on this forum. I’ve been attempting to develop backtest scripts now for a couple of months, and without these forums I would be extremely lost.
Secondly, I have attached my first script there. I would greatly appreciate if one of the more advanced users on the forum could take some time to give it a peer review? Of course, I’m happy for the feedback to be posted to the forum so that any other newcomers could benefit from the feedback I receive.
The strategy description is as follows: It is focused on intra-day trading, looking at price excursion away from the morning session day high / low. It is designed to be the basis for trading the afternoon session of the NYSE (New York Stock Exchange) based on the morning session high / lows. Once the price has moved outside of the day high / low, it then looks for the first move back towards that range (i.e. if the price is now above the morning high, the strategy looks to enter after the first negative bar back towards the day range).
Unfortunately, from early back tests the strategy is flawed. However, I think much of the code contained within might be reuseable. For example, the entry & exit code with minor adjustments. In the end coding the strategy become a learning exercise.
Some key points of note:
• I have been running this script consistency against HPQ (NYSE) over the last couple of months while I’ve been developing it
• The backtest should be run on a 5 min bar chart – I’ve personally been using candlestick charts though I don’t think it matters if it is a standard bar chart
• I have been using standard settings in the strategy analyser (i.e. 100 contracts / shares, 0 commission / slippage, etc)
Two of the areas that I’ve had a challenge with while building the script were:
Background colouring
I can’t seem to get the background to colour appropriately. I’m to understand from reading the forums that this is not working in this build version of Esignal. However, I have also tried colouring the bars themselves to mark entry points, this doesn’t seem to be working either. I’m a little confused how the chart is updated while it is static. That is, when using a chart for backtesting purposes it appears to me to be necessary to load all the necessary data (in this case it is intra-day 5 min bars up to 120 days). Only then will the backtest run across all that data. I’m a little confused on how Esignal updates that static chart when running a backtest? Is the background & bar colouring functionality only aimed at playback and real time strategy analysis?
Exits / drawdown
I’ve found challenging is reconciling the stop-loss exits with the drawdown numbers reported in the strategy analyser. For example, if you run this script against HPQ you will find trades on the 30/04/08 and 01/05/08 (N.B. dates in European format). In each of those traded you will note that the maximum drawdown on each of those trades is drawdown which is significantly over and above the stop loss points in the strategy. However, the actual reported exit point is correct. This is worrisome; I think what is happening is that the Strategy Analyser is reporting that the position is open all the way through the bar, but then closing out the position when bar closes – but reporting that the trade is being held all throughout the development of the bar, when it should be reporting the position as closed when the stop kicks in.
Any help or guidance more experienced members of the forum could offer would be greatly appreciated.
Kind regards,
Dan
Comment