 Tweet
Tweet
Hello,
I have been running a fair number of backtests on various strategies
that I have coded using the EFS editor recently.
I have a few questions regarding the output.
First I should specify that all my slippage, commissions costs have
been set to 0 for my backtesting (I'm currently trying to determine which
if any strategies would work before transactions costs). I am also
using a default of 1000 shares per trade.
I have noticed that on several occassions there are discrepancies with
respect to the prices that the backtester says I would obtain, and what
the chart says would be obtained. For example, if I wish to be filled
at the close of a bar, the chart may identify the bar's close at 45.01
and the backtester at 45. Note I have ensured that both the backtester
and chart are using the identical symbol.
I am wondering what other explanations would cause this?
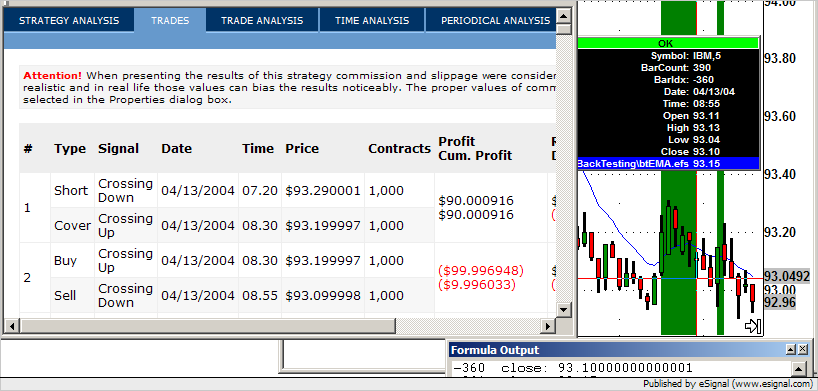
Another question I have reflects the amount made per trade. On several
occassion the backtester indicates I would earn 9.99$ if the trade was
a penny profitable on 1000 shares. Obviously this should read 10$.
I'm really at a loss to explain this.
To get a better idea of what I mean you can take the "btEMA.efs"
formula which I believe comes standard with E Signal in the "Backtesting"
folder, and run it for 5 days or so. Enter 1000 share default, with no
commissions costs or slippage.
At the beginning this seems to work find, but as time progresses you
will notice that you will see numbers such as 9.99$ in the Profit/***
Profit column. You will also notice that the price differential between
where you open and where you close the trades does not always equal the
profit for the trade (due to the fact that the open and closing prices
may not reflect what is actually on the chart).
If you take a look I think you'll see what I'm talking about.
I'm just wondering if this problem has already been reported, or if
there is something else I'm missing.
Oh yeah I'm running E Signal version 7.5.
I tried emailing the E Signal customer support people and they told me to post this here.
Thanks in advance for any help you can give me.
Tom
I have been running a fair number of backtests on various strategies
that I have coded using the EFS editor recently.
I have a few questions regarding the output.
First I should specify that all my slippage, commissions costs have
been set to 0 for my backtesting (I'm currently trying to determine which
if any strategies would work before transactions costs). I am also
using a default of 1000 shares per trade.
I have noticed that on several occassions there are discrepancies with
respect to the prices that the backtester says I would obtain, and what
the chart says would be obtained. For example, if I wish to be filled
at the close of a bar, the chart may identify the bar's close at 45.01
and the backtester at 45. Note I have ensured that both the backtester
and chart are using the identical symbol.
I am wondering what other explanations would cause this?
Another question I have reflects the amount made per trade. On several
occassion the backtester indicates I would earn 9.99$ if the trade was
a penny profitable on 1000 shares. Obviously this should read 10$.
I'm really at a loss to explain this.
To get a better idea of what I mean you can take the "btEMA.efs"
formula which I believe comes standard with E Signal in the "Backtesting"
folder, and run it for 5 days or so. Enter 1000 share default, with no
commissions costs or slippage.
At the beginning this seems to work find, but as time progresses you
will notice that you will see numbers such as 9.99$ in the Profit/***
Profit column. You will also notice that the price differential between
where you open and where you close the trades does not always equal the
profit for the trade (due to the fact that the open and closing prices
may not reflect what is actually on the chart).
If you take a look I think you'll see what I'm talking about.
I'm just wondering if this problem has already been reported, or if
there is something else I'm missing.
Oh yeah I'm running E Signal version 7.5.
I tried emailing the E Signal customer support people and they told me to post this here.
Thanks in advance for any help you can give me.
Tom
Comment