Hello fflaque,
This is very strange. We have similar systems, so I don't think that's the issue. Are you currently using version 7.6 build 636a?
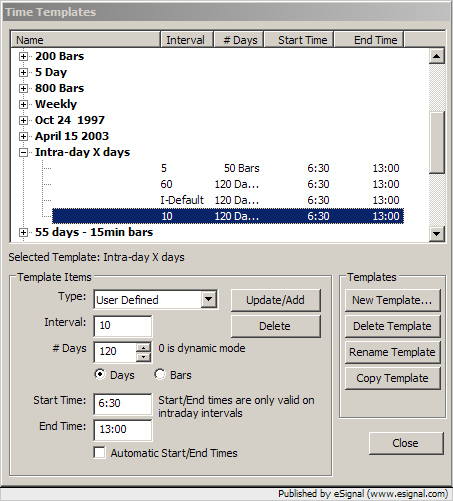
Are you specifying a start and end time in your time template settings? Check to make sure your settings are similar to the image below.

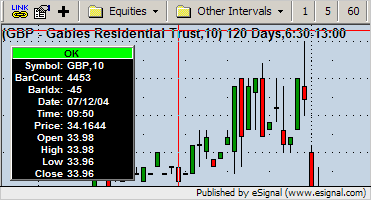
Please post a chart image of your GBP,10 with your time template applied. You should see 120 Days and the start/end time like in the image below. Also, right click on the cursor window and turn on the Bar Count. We should more than 4450 bars.

With this chart of GBP, 10 min running and using the proper time template, make sure that you select the proper settings when running the back test like below. Your time template name and the path to the formula will be different of course.

Another thing to check is that your chart has the proper data loaded. If you scroll back (Ctrl+left arrow) in time, the first day of data should be 1/28/2004 for a time template covering 120 days. For 90 days, the first day should be 3/10/2004. Make sure the data is present in your chart when you run the back test.
The current version of your formula that I'm testing with is attached. Make sure I'm using the same version as you.
This is very strange. We have similar systems, so I don't think that's the issue. Are you currently using version 7.6 build 636a?
Are you specifying a start and end time in your time template settings? Check to make sure your settings are similar to the image below.

Please post a chart image of your GBP,10 with your time template applied. You should see 120 Days and the start/end time like in the image below. Also, right click on the cursor window and turn on the Bar Count. We should more than 4450 bars.

With this chart of GBP, 10 min running and using the proper time template, make sure that you select the proper settings when running the back test like below. Your time template name and the path to the formula will be different of course.

Another thing to check is that your chart has the proper data loaded. If you scroll back (Ctrl+left arrow) in time, the first day of data should be 1/28/2004 for a time template covering 120 days. For 90 days, the first day should be 3/10/2004. Make sure the data is present in your chart when you run the back test.
The current version of your formula that I'm testing with is attached. Make sure I'm using the same version as you.
Comment