Announcement

Collapse
No announcement yet.

Linear Regression slope change

Collapse
X
 
  • Filter
  • Time
  • Show
Clear All
new posts

  • Linear Regression slope change

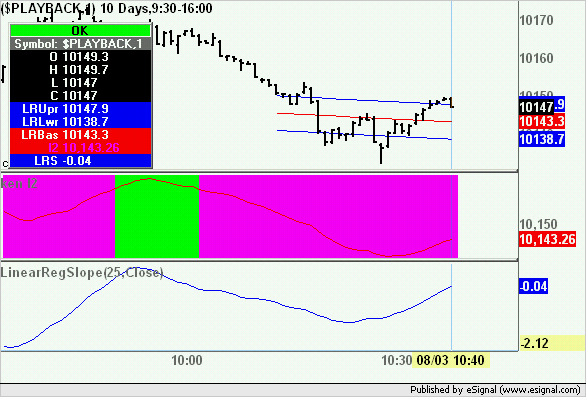
    I am trying to display a backgroung color change based on the slope change of the Linear Regression Slope code generated by the Wizard. The code works but tThe background color change seems at best to respond with a 4 to 5 bar delay. Could you advise how best to correct the code to respond within the following bar of a slope change or at a max within 2 bars of a slope change?

    I have tried to increase the offset to -2 and -3 but to no better results. The plotting of the LinearRegression value seems to be correct. Please advise how to accomplish if possible. The Wizard generated efs is attached.
    Thanks
    kenac

  • #2
    Linear Regression Slope file attachment

    Linear Regression Slope change efs file attachment
    kenac
    Attached Files

    Comment


    • #3
      kenac
      To see the reason for the apparent lag load in the same chart the Linear Regression that is in Basic Studies and set the Number of bars to 25 and run them side by side.
      In the image below you will see that the background color set by your efs is still magenta even though the plot appears to be on the rise. However if you look at the Linear Regression Channel in the price window you will see that it is still pointing downwards. This is further confirmed by the negative value of the Linear Regression Slope study (bottom indicator window) that returns the value of the slope rather than price as in your efs. You may want to use the latter efs to plot the Linear Regression Slope as it has the benefit amongst other things of providing you the correct historical values. You can find the Linear Regression Slope efs here
      Alex

      Comment


      • #4
        Linear Regression Slope

        Thanks Alex. It works well.
        kenac

        Comment

        Working...
        X