Announcement

Collapse
No announcement yet.

Using PercentR in Wizard

Collapse
X
 
  • Filter
  • Time
  • Show
Clear All
new posts

  • Using PercentR in Wizard

    Something is not right in the way the Formula Wizard handles PercentR. I have a routine that gives a message:

    . . line 10 Can not find internal class construct builtin study

    But when I add the word "new" in front of "PercentRStudy" in line 10, then the error message goes away and it executes fine.

    Of course, every time I update the file in the wizard then I have to go into the efs editor to add back "new". So I would prefer having the Wiz do that for me.

    Is there any other way to get the Wiz to handle this correctly?

    Thanks.
    Attached Files

  • #2
    jcprinster
    That problem is fixed in version 7.9.1 (build 732). See this thread on this issue
    Alex

    Comment


    • #3
      Thank you for that response. It clears that up.

      I have one follow-up that I would like to explore. I am trying to apply a Williams PercentR from a different time frame. (eg, applying a 10-period PercentR from 5 min chart into a 1 minute chart).

      I started with a Wizard, and could not figure out how to apply a 5min PercentR into a 1min chart. I have learned the PercentR is not linear, so merely multiplying the period by 5 (ie, using a 50-period PercentR in a 1min chart) does not give the same results as a 10-period in a 5min chart.

      So I am now working from the Custom EFS2 formula for PercentR (CustomePercentR.efs) and altering it. That is giving me pretty good results, except for one thing.

      I would like to display the value for the 10-per PercentR-5min on the 1-min chart and cannot get it to work.

      In the 50-period Wizard, I got the display to work by adding this:

      vR50J = vPctR50.getValue(PercentRStudy.PERCENTR);
      vR50J = (Math.round(vR50J * 10)) / 10;
      drawTextAbsolute( -2, 40, " WmR50= " + vR50J + " %", Color.black, Color.lightgrey, Text.BOLD | Text.RELATIVETORIGHT | Text.RELATIVETOBOTTOM, "Arial", 14, "WmR Value" );

      But in the file built on CustomPercentR.efs, if I try to use the xPercentR in my draw command, like this . . . . . . :

      vR50J = xPercentR;
      vR50J = (Math.round(vR50J * 10)) / 10
      drawTextAbsolute( -2, 140, " WmR5inv5m= " + vR50J + " %", Color.black, Color.lightgrey, Text.BOLD | Text.RELATIVETORIGHT | Text.RELATIVETOBOTTOM, "Arial", 14, "WmR Value" );

      . . . . then I get that varialble to draw NaN instead of the value. Does a "NaN " message mean something like "Not a Number"? The xPercentR variable is the same as in the CustomPercentR.efs. I am inserting this code snippet in the function main, just before the return command.

      How do I configure the draw command to corrrectly draw the value for xPercentR ?

      Thank you very much.

      Comment


      • #4
        I have another related problem I would like to mention. I am finding that the CustomPercentR.efs (from the EFS2 Custom folder) is returning different values than all the following:

        BuiltinPercentR.efs (from Builtin folder)
        BasicPercentR.efs (from EFS 2 Basic folder)
        Basic Studies / PercentR (appling it using the Rt- Mouse button).


        All 3 of those return the same values. But the CustomPercentR.efs differes, even when the settings are identical (same period, interval, etc).

        Do you know about this? I would be very grateful for your help.

        I have not upgraded to 7.9.1 yet, so if all this was solved in that new release, please let me know. I am using some 3rd party software and that developer is telling us not to upgrade yet.

        Thanks very much for your help. Joe.

        Comment


        • #5
          jcprinster
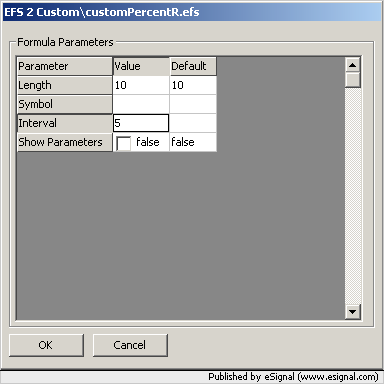
          If you want to plot the PercentR study based on an interval (or symbol) that is different from the one being charted then the customPercentR.efs is already preset to do that. When you first load the efs it will open the Parameters dialog box which you can set as shown in the enclosed image to obtain the study you want.
          You can also call the Parameters dialog box at any time by right clicking the chart and selecting Edit Studies


          To write the value of the PercentR study you need to retrieve it as shown in the following example

          PHP Code:
          vR50J xPercentR.getValue(0);
          vR50J = (Math.round(vR50J 10)) / 10
          drawTextAbsolute
          ( -2140" WmR5inv5m= " vR50J " %"Color.blackColor.lightgrey
                          
          Text.BOLD Text.RELATIVETORIGHT Text.RELATIVETOBOTTOM"Arial"14"WmR Value" ); 
          However if all you want to do is write the value of the study and not plot it then you don't necessarily need to use that efs and you could just call the study as in the following example

          PHP Code:
          var myStudy percentR(10,inv(5));
          vR50J myStudy.getValue(0);
          vR50J = (Math.round(vR50J 10)) / 10
          drawTextAbsolute
          ( -2140" WmR5inv5m= " vR50J " %"Color.blackColor.lightgrey
                          
          Text.BOLD Text.RELATIVETORIGHT Text.RELATIVETOBOTTOM"Arial"14"WmR Value" ); 
          For information on the percentR() function and the required syntax see this article in the EFS KnowledgeBase.
          Alex

          Comment


          • #6
            Joe

            But the CustomPercentR.efs differes, even when the settings are identical (same period, interval, etc).

            That is due to an error I made when I coded that efs and used a non standard parameter for the PercentR study.
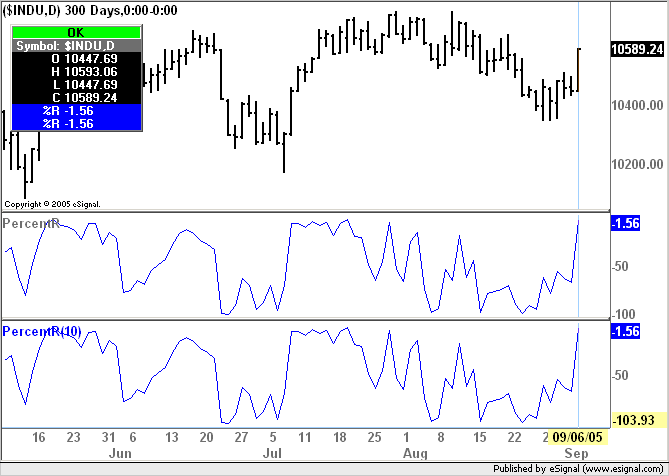
            Replace the efs in your EFS2 Custom folder with the one attached and it should return the correct values (in the image you can see the plot of the revised efs compared to the Basic Studies version)
            Alex

            Attached Files

            Comment


            • #7
              Alex, thank you very much for your help.

              Part of my problem comes from not knowing how to make those calls properly. You have given me enough to solve my problem, and I will study and learn from them for the future.

              Again, thanks. Best regards.

              Comment


              • #8
                Alexis, I continue to work with the percentR routine on different time frames. I have run across another issue that I would like to discuss.

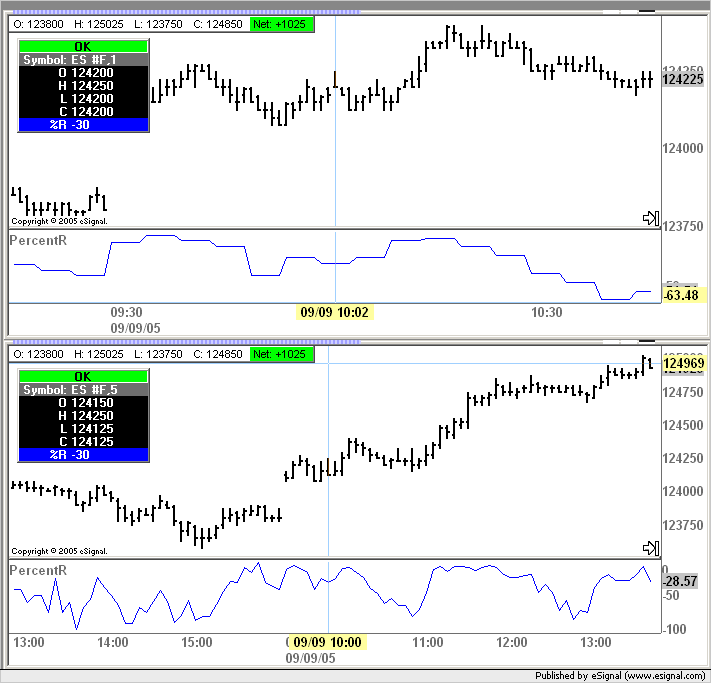
                I am finding that using the percentR on a chart with a different interval gives the same values for percentR on the "native" interval chart EXCEPT early in the trading day. The attached picture shows vertical lines which differentiate the time when it works and when it does not.

                That time is 8:15 am MT. From 8:15 am MT on, the charts agree. From market-open at 7:30am MT until 8:14 am, they do NOT agree. You can see that displayed on the scales on the right of the screen, and the cursor window.

                Both charts have appropriate time templates defining the market times. Both charts have the EFS2-Custom/CustomPercentR.efs with settings period = 10 and interval = 5.

                So it is the same efs running on both charts, with the exact same settings.

                Can you replicate this? Do you have any ideas?
                Attached Files

                Comment


                • #9
                  Joe
                  I cannot replicate what you are seeing. The enclosed image shows what I get when running customPercentR.efs using the same symbol, settings and times (adjusted for EDT) as yours.
                  One thing you may want to check is that the settings for the 5 minute Interval in the Time Template used in the 1 minute chart are actually the same as those used in the Time Template loaded in the 5 minute chart.
                  Alex

                  Comment


                  • #10
                    Thanks Alexis. The time template was the problem. I had not known the EACH time template could have values for different intevals. That fixed it right up !

                    I was starting to experiment with using the symbol ES #F=2, but that was just a clunky fix. The time template was the ticket.

                    Thanks very much.

                    Joe.

                    Comment


                    • #11
                      Joe
                      That is correct. Each Time Template can contain the definitions for different intervals each with their own settings.
                      For more information on Time Templates see this article in the eSignal KnowledgeBase
                      Alex

                      Comment

                      Working...
                      X