Announcement

Collapse
No announcement yet.

can it be done

Collapse
X
 
  • Filter
  • Time
  • Show
Clear All
new posts

  • can it be done

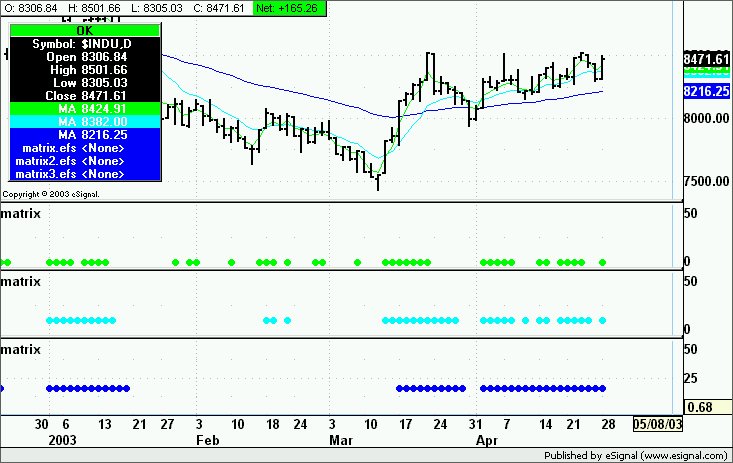
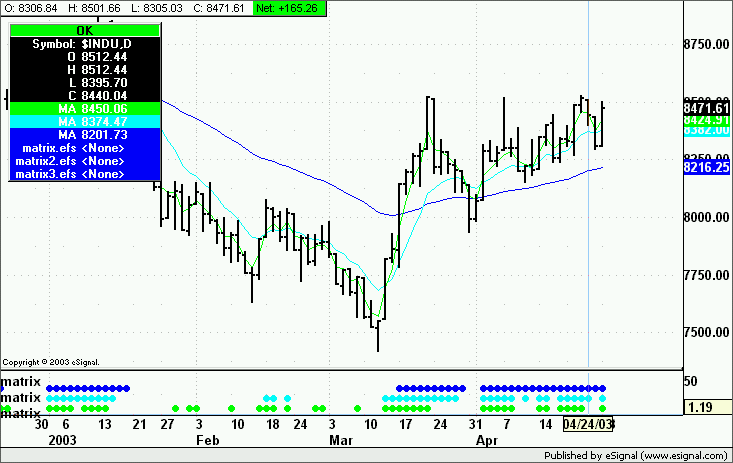
    I have 3 wizard fomulas that draw 3 separate subcharts on a chart. They consist of 2-dot and 1-line subcharts. Is it possible to combine these 3 subcharts into one single subchart?

    Thanks,

    DaTr8dr

    PS If necessary, I can attach the 3 files.

  • #2
    have you tried looking at these .pngs of alex's? you may be able to merge them.
    Michael

    Comment


    • #3
      Thanks for the suggestion, Michael, but I had tried that. Since the windows are single rows of dots and a single line, the stack on top of each other. If I knew how to stager them so that I would have 3 separate rows on a single subchart (2 single rows of dots and 1 single row of a line) it would work great.

      Do you know how to offset the rows. I am attaching a screen shot of what I am talking about.

      Thanks,

      DaTr8dr
      Attached Files

      Comment


      • #4
        haven't a clue on that...but from the looks of it i guess you are attempting to visually determine prime trading areas with the 3 panes. perhaps you could combine the conditions in an efs and have it paint or draw something on your price chart to assist you?
        if that works and it then is a space problem, you could even then remove the setPlotTypes to remove the indicator panes and have your prime areas on your price chart only.
        good luck.
        Michael

        Comment


        • #5
          DaTr8dr
          Here is a possible solution (see attached image).
          Change each of your efs to plot on the price window and then in each one set the dots to be plotted at a specific point in the chart relative to the top or bottom.
          In the three separate formulas that were used for the attached chart I had

          drawShapeRelative(0, 0, Shape.CIRCLE, "", Color.lime, Shape.RELATIVETOBOTTOM);
          drawShapeRelative(0, 10, Shape.CIRCLE, "", Color.cyan, Shape.RELATIVETOBOTTOM);
          drawShapeRelative(0, 20, Shape.CIRCLE, "", Color.blue, Shape.RELATIVETOBOTTOM);

          The vertical position of the dots is determined by the second of the two numbers which controls the y axis.
          Hope this helps
          Alex
          Attached Files
          Last edited by ACM; 04-29-2003, 04:10 AM.

          Comment


          • #6
            DaTr8dr
            (continues from prior message)
            If instead you prefer to have them in a separate window you would do as follows.
            Make sure that you have a setSudyMin(value1) and setStudyMax(value2) in each efs so that all the indicator panes are identical then plot the circles and position them using the same statement as in the prior message.
            This should be the result


            Then you simply merge the studies and they should appear as follows since the plots are now staggered on the y axis.


            Hope this helps
            Alex
            Last edited by ACM; 04-29-2003, 05:09 AM.

            Comment


            • #7
              Alex,

              You are my gardian angel. Thanks, it worked fine.

              I am working on a couple of other things that I am sure you will hear from me.

              Thanks again.

              DaTr8dr

              Comment


              • #8
                Would you mind attaching the EFS?

                Thanking You In Advance.

                Comment


                • #9
                  actually it takes 3 formulas, one for each row. I am sending it as a zipped file.

                  DaTr8dr
                  Attached Files

                  Comment


                  • #10
                    Duh, so I asked myself why it would take 3 formulas and the answer was, it doesn't.

                    Here is the script for all dots/line plots in one formula.

                    DaTradr
                    Attached Files

                    Comment


                    • #11
                      I like the dots...

                      Can you please provide a "manual" for understanding them?

                      I can see they indicate a reversal but just not completely sure I understand....

                      THANKING YOU IN ADVANCE

                      Comment


                      • #12
                        There is no manual. One could watch for green dots/line for long entry and red dots/line for short entry.

                        Comment


                        • #13
                          I guess, since you wrote the formula, you could explain exactly how it works and how to use it.

                          I notice that when a blue dot appears (3-10 oscillator I think), and the dot below is red and the box below is red, that seems to signal a "safe" entry.

                          I don't have a handle on using the blue dot to exit.

                          Perhaps you can explain further...

                          Thanking You in Advance.
                          Attached Files

                          Comment


                          • #14
                            Text in place of dots

                            Following on from this - where the line:

                            drawShapeRelative(0, 10, Shape.SQUARE, "", Color.RGB(255,0,0), Shape.RELATIVETOBOTTOM);

                            draws the dots at the bottom of the main chart area ......

                            Is there a way to do the same thing but with text?

                            Using drawTextRelative(0,10, "TestMsg", Color.RGB ...etc) writes the text where zero occurs in the y-axis. Is there a way to write text such that it stays at the bottom of the main chart regardless of the y-axis values changing over time?

                            Many thanks

                            MauriceP

                            Comment


                            • #15
                              Maurice P

                              drawTextRelative(0, 0, "z", Color.lime, Color.black, Text.RELATIVETOBOTTOM | Text.CENTER, "Arial", 10, bar)

                              prints a z at the bottom of the chart.

                              Comment

                              Working...
                              X