Announcement

Collapse
No announcement yet.

Bollinger band

Collapse
X
 
  • Filter
  • Time
  • Show
Clear All
new posts

  • Bollinger band

    I tried to create this type of indicator.

    I would want to mark all the bars that touch the upper BB, and also mark the bars that touch the lower BB.

    Here is the snapshot of the formula wizard

    I don't know why it doesn't work.
    May be I have to add something to "return data point" but I don't want to return Bollinger band on my chart.

    Can anyone help me?

    Thanks
    Attached Files

  • #2
    Marknav
    The code you show in your screenshot appears to be working.
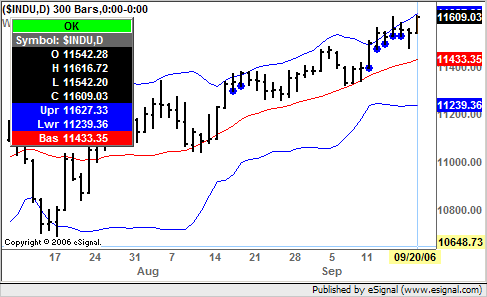
    In the image enclosed below you can see the circles drawn by the script (the chart also includes the Basic Studies Bollinger Bands for comparison purposes).
    Alex

    Comment


    • #3
      I don't konw why, for what reason, the formula doesn't work.

      Well, only few bars are being signaled, as shown in the example, but the last ones are not marked.

      when I scroll the chart, when it stops for getting data, I can see for few seconds the blue circle, and then disappear.

      In this case I plot the ES Z6 chart, but it signals with the same color the bars that touch the lower and upper band, although in the code I specified, blue the upper ones, and red the others, by setting SET1 and SET2.

      In the case of CSCO, I went back slowly until I could see the circle, before going away.

      Thanks
      Attached Files

      Comment


      • #4
        here the other one
        Attached Files

        Comment


        • #5
          Marknav
          Without seeing the complete code it is not possible to determine what may be causing the problem.
          Please post (or attach) the efs so that I or someone else can give it a look.
          Alex

          Comment

          Working...
          X