Announcement

Collapse
No announcement yet.

To Check From Current Bar Only

Collapse
X
 
  • Filter
  • Time
  • Show
Clear All
new posts

  • To Check From Current Bar Only

    Hi, the following works fine for me except it doesnt just work from JUST the current bar backwards. E.g. it looks for 3 down bars in a row, it will highlight the last time there were 3 down bars when all i want it to do is alert me when the current bar is the 3rd down bar. E.g. if i have had 3 down bars and then an up bar, the last down bar will be highlighted, i dont want it to be, I only want the alert when the current bar is a the 3rd of 3 down bars, this is kinda hard to explain, i hope i have done so ok.

    Thanks in advance for any assistance. (ps is there any way that I can get test to appear as well as the shape ? Maybe even the price ((high & low) Greedy)?)


    //{{EFSWizard_Description
    //
    // This formula was generated by the Alert Wizard
    //
    //}}EFSWizard_Description


    //{{EFSWizard_Declarations
    var vLastAlert = -1;
    //}}EFSWizard_Declarations


    function preMain() {
    /**
    * This function is called only once, before any of the bars are loaded.
    * Place any study or EFS configuration commands here.
    */
    //{{EFSWizard_PreMain
    setPriceStudy(true);
    setStudyTitle("3 bar dec");
    //}}EFSWizard_PreMain

    }

    function main() {
    /**
    * The main() function is called once per bar on all previous bars, once per
    * each incoming completed bar, and if you don't have 'setComputeOnClose(true)'
    * in your preMain(), it is also called on every tick.
    */

    //{{EFSWizard_Expressions
    //{{EFSWizard_Expression_1
    if (
    close() < open() &&
    close(-1) < open(-1) &&
    close(-2) < open(-2)
    ) onAction1();
    //}}EFSWizard_Expression_1

    //}}EFSWizard_Expressions


    //{{EFSWizard_Return
    return null;
    //}}EFSWizard_Return

    }

    function postMain() {
    /**
    * The postMain() function is called only once, when the EFS is no longer used for
    * the current symbol (ie, symbol change, chart closing, or application shutdown).
    */
    }

    //{{EFSWizard_Actions
    //{{EFSWizard_Action_1
    function onAction1() {
    drawShapeRelative(0, low(), Shape.CIRCLE, "", Color.RGB(155,0,0), Shape.LEFT, "3 bar dec.");
    vLastAlert = 1;
    }
    //}}EFSWizard_Action_1

    //}}EFSWizard_Actions
    Last edited by wilczek; 01-10-2007, 09:49 AM.

  • #2
    Re: To Check From Current Bar Only

    Hello wilczek,

    Originally posted by wilczek
    Hi, the following works fine for me except it doesnt just work from JUST the current bar backwards. E.g. it looks for 3 down bars in a row, it will highlight the last time there were 3 down bars when all i want it to do is alert me when the current bar is the 3rd down bar. E.g. if i have had 3 down bars and then an up bar, the last down bar will be highlighted, i dont want it to be, I only want the alert when the current bar is a the 3rd of 3 down bars, this is kinda hard to explain, i hope i have done so ok.
    If I understand correctly, it sounds like you do not want to have any bars prior to the current bar highlighted. If so, then what you can do is first move your current condition in Set 1 to Set 2. Change Set 1 to look for BARSTATE_NEWBAR with getBarState(). Then add to the action for "only the first time" to remove your shape object using the removeShape() function. These functions used for Set 1 are not included in the menu choices from the edit button. You will just type these into the fields as in the image below.


    Thanks in advance for any assistance. (ps is there any way that I can get test to appear as well as the shape ? Maybe even the price ((high & low) Greedy)?)
    Sure, in your Set 2 condition you can add another line and enter a drawTextRelative() function. If you want that text label to display the high or low you would pass high(0) or low(0) for the text parameter of that function. If you want this text label to behave in the same manner as the shape object then you would add another line item to Set 1 and use removeText() in the same way removeShape() was used.
    Jason K.
    Project Manager
    eSignal - an Interactive Data company

    EFS KnowledgeBase
    JavaScript for EFS Video Series
    EFS Beginner Tutorial Series
    EFS Glossary
    Custom EFS Development Policy

    New User Orientation

    Comment


    • #3
      Cool, thanks a lot, very helpful. Of course there is now more, I hope you dont mind helping if you can. Is it possible for me to display at the bottom of the bar in the centre over 3 lines, "3 Bar Desc.", high(0) and on the last line Low(0) ? e.g.

      3 Bar Desc.
      120
      115

      Thanks in advance,

      Oh yeah and any chance I can have it so I have for instance a weeks extra space as the end of my charts, e.g. chart goes back 6 months but instead of being right up to the right hand side of the chart there is a space of say 2 weeks. I hope this isnt a programming option and its something silly I have missed on chart set-up.

      Thanks again.

      Comment


      • #4
        Hello wilczek,

        Originally posted by wilczek
        Cool, thanks a lot, very helpful. Of course there is now more, I hope you dont mind helping if you can. Is it possible for me to display at the bottom of the bar in the centre over 3 lines, "3 Bar Desc.", high(0) and on the last line Low(0) ? e.g.

        3 Bar Desc.
        120
        115

        Thanks in advance,
        Yes, in the same condition where you draw the shape, you would draw these three text labels using three separate drawTextRelative() lines. For the bar index value, you would use -1 and the Text.CENTER flag to center them across the three bars. To space them vertically above or below the bars, use the location constants, AboveBar1, AboveBar2, AboveBar3 or BelowBar1, BelowBar2 and BelowBar3. These would be passed to the y-value parameters of the drawTextRelative() calls. You'll also need to add the Text.PRESET flag in order for these to work. Give it a shot and if you have any trouble, post your updated code.

        Oh yeah and any chance I can have it so I have for instance a weeks extra space as the end of my charts, e.g. chart goes back 6 months but instead of being right up to the right hand side of the chart there is a space of say 2 weeks. I hope this isnt a programming option and its something silly I have missed on chart set-up.

        Thanks again.
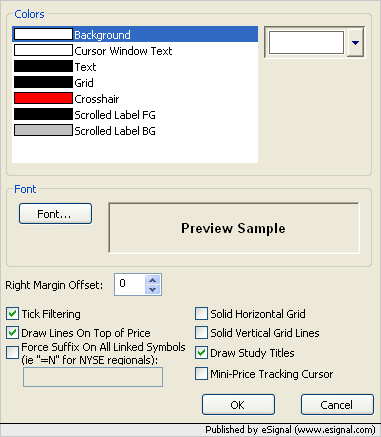
        The right margin offset can be set through the properties of the Advanced chart. Right click on the chart and select Properties. Then increase the value for the Right Margin Offset to suite your needs.

        Jason K.
        Project Manager
        eSignal - an Interactive Data company

        EFS KnowledgeBase
        JavaScript for EFS Video Series
        EFS Beginner Tutorial Series
        EFS Glossary
        Custom EFS Development Policy

        New User Orientation

        Comment


        • #5
          Thanks for that, as usual, excellent help, I think I have managed it but my code probably looks very amateurish ! Anyway, is there a way I can make the text bold even if I have used TEXT.PRESET.

          Thanks again.

          Comment


          • #6
            Sorry, is there also a way i can restrict my high low values to 2 decimal places, thanks.

            Comment


            • #7
              Hello wilczek,

              To use multiple text flags you can OR them together with a pipe (i.e. | ). For example, Text.PRESET|Text.BOLD|Text.CENTER.

              To force the result of high(0) to 2 decimals you can use the .toFixed(2) method. For example, high(0).toFixed(2).
              Jason K.
              Project Manager
              eSignal - an Interactive Data company

              EFS KnowledgeBase
              JavaScript for EFS Video Series
              EFS Beginner Tutorial Series
              EFS Glossary
              Custom EFS Development Policy

              New User Orientation

              Comment


              • #8
                wilczek
                To add to Jason's suggestion you may also want to try using the formatPriceNumber() function in place of the .toFixed() method ie formatPriceNumber(high(0)) in place of high(0).toFixed(2)
                In this case the number drawn on the chart will display in the same format as that of the symbol being charted
                Alex

                Comment

                Working...
                X