 Tweet
Tweet
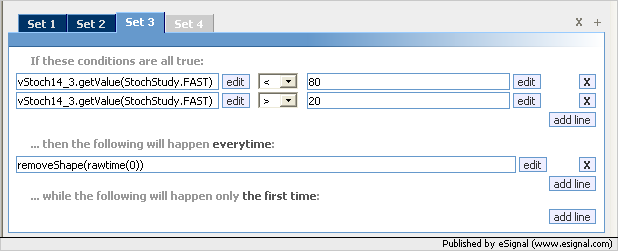
I managed to get an efs study to show stochastic crossovers over the 80,below 20 threshold with an alert sound and circle on top/bottom on the chart, but for some reason, it doesn't draw a circle over the overbought crossovers(over 80). Would like to somehow put in a code to reset once it goes below the 80, above 20 threshold. Alerts should be left the same.
Thanks in advance
Here's the study, any help would be appreciated. Im gonna put both the file and the language up
//{{EFSWizard_Description
//
// This formula was generated by the Alert Wizard
//
//}}EFSWizard_Description
//{{EFSWizard_Declarations
var vStoch14_3 = new StochStudy(14, 3, 3);
var vLastAlert = -1;
//}}EFSWizard_Declarations
function preMain() {
/**
* This function is called only once, before any of the bars are loaded.
* Place any study or EFS configuration commands here.
*/
//{{EFSWizard_PreMain
setPriceStudy(true);
setStudyTitle("Stochastic Crossover");
//}}EFSWizard_PreMain
}
function main() {
/**
* The main() function is called once per bar on all previous bars, once per
* each incoming completed bar, and if you don't have 'setComputeOnClose(true)'
* in your preMain(), it is also called on every tick.
*/
//{{EFSWizard_Expressions
//{{EFSWizard_Expression_1
if (
vStoch14_3.getValue(StochStudy.FAST) > 80 &&
vStoch14_3.getValue(StochStudy.SLOW) > 80 &&
vStoch14_3.getValue(StochStudy.FAST) < vStoch14_3.getValue(StochStudy.SLOW)
) onAction1()
//}}EFSWizard_Expression_1
//{{EFSWizard_Expression_2
else if (
vStoch14_3.getValue(StochStudy.FAST) < 20 &&
vStoch14_3.getValue(StochStudy.SLOW) < 20 &&
vStoch14_3.getValue(StochStudy.FAST) > vStoch14_3.getValue(StochStudy.SLOW)
) onAction2();
//}}EFSWizard_Expression_2
//}}EFSWizard_Expressions
//{{EFSWizard_Return
return null;
//}}EFSWizard_Return
}
function postMain() {
/**
* The postMain() function is called only once, when the EFS is no longer used for
* the current symbol (ie, symbol change, chart closing, or application shutdown).
*/
}
//{{EFSWizard_Actions
//{{EFSWizard_Action_1
function onAction1() {
if (vLastAlert != 1) Alert.addToList(getSymbol(), "Overbought Crossover", Color.RGB(0,0,0), Color.RGB(195,0,0));
if (vLastAlert != 1) Alert.playSound("C:\\Program Files\\eSignal\\Sounds\\Ding.wav");
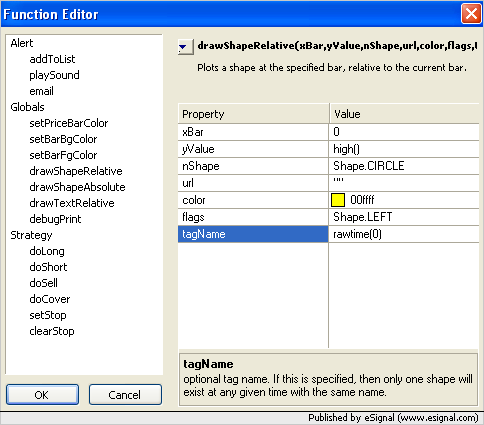
if (vLastAlert != 1) drawShapeRelative(0, high(), Shape.CIRCLE, "", Color.RGB(255,255,0), Shape.LEFT);
;
vLastAlert = 1;
}
//}}EFSWizard_Action_1
//{{EFSWizard_Action_2
function onAction2() {
if (vLastAlert != 2) Alert.addToList(getSymbol(), "Oversold Crossover", Color.RGB(0,0,0), Color.RGB(0,255,0));
if (vLastAlert != 2) Alert.playSound("C:\\Program Files\\eSignal\\Sounds\\Ding.wav");
if (vLastAlert != 2) drawShapeRelative(0, low(), Shape.CIRCLE, "", Color.RGB(0,255,0), Shape.BOTTOM);
vLastAlert = 2;
}
//}}EFSWizard_Action_2
//}}EFSWizard_Actions
Thanks in advance
Here's the study, any help would be appreciated. Im gonna put both the file and the language up
//{{EFSWizard_Description
//
// This formula was generated by the Alert Wizard
//
//}}EFSWizard_Description
//{{EFSWizard_Declarations
var vStoch14_3 = new StochStudy(14, 3, 3);
var vLastAlert = -1;
//}}EFSWizard_Declarations
function preMain() {
/**
* This function is called only once, before any of the bars are loaded.
* Place any study or EFS configuration commands here.
*/
//{{EFSWizard_PreMain
setPriceStudy(true);
setStudyTitle("Stochastic Crossover");
//}}EFSWizard_PreMain
}
function main() {
/**
* The main() function is called once per bar on all previous bars, once per
* each incoming completed bar, and if you don't have 'setComputeOnClose(true)'
* in your preMain(), it is also called on every tick.
*/
//{{EFSWizard_Expressions
//{{EFSWizard_Expression_1
if (
vStoch14_3.getValue(StochStudy.FAST) > 80 &&
vStoch14_3.getValue(StochStudy.SLOW) > 80 &&
vStoch14_3.getValue(StochStudy.FAST) < vStoch14_3.getValue(StochStudy.SLOW)
) onAction1()
//}}EFSWizard_Expression_1
//{{EFSWizard_Expression_2
else if (
vStoch14_3.getValue(StochStudy.FAST) < 20 &&
vStoch14_3.getValue(StochStudy.SLOW) < 20 &&
vStoch14_3.getValue(StochStudy.FAST) > vStoch14_3.getValue(StochStudy.SLOW)
) onAction2();
//}}EFSWizard_Expression_2
//}}EFSWizard_Expressions
//{{EFSWizard_Return
return null;
//}}EFSWizard_Return
}
function postMain() {
/**
* The postMain() function is called only once, when the EFS is no longer used for
* the current symbol (ie, symbol change, chart closing, or application shutdown).
*/
}
//{{EFSWizard_Actions
//{{EFSWizard_Action_1
function onAction1() {
if (vLastAlert != 1) Alert.addToList(getSymbol(), "Overbought Crossover", Color.RGB(0,0,0), Color.RGB(195,0,0));
if (vLastAlert != 1) Alert.playSound("C:\\Program Files\\eSignal\\Sounds\\Ding.wav");
if (vLastAlert != 1) drawShapeRelative(0, high(), Shape.CIRCLE, "", Color.RGB(255,255,0), Shape.LEFT);
;
vLastAlert = 1;
}
//}}EFSWizard_Action_1
//{{EFSWizard_Action_2
function onAction2() {
if (vLastAlert != 2) Alert.addToList(getSymbol(), "Oversold Crossover", Color.RGB(0,0,0), Color.RGB(0,255,0));
if (vLastAlert != 2) Alert.playSound("C:\\Program Files\\eSignal\\Sounds\\Ding.wav");
if (vLastAlert != 2) drawShapeRelative(0, low(), Shape.CIRCLE, "", Color.RGB(0,255,0), Shape.BOTTOM);
vLastAlert = 2;
}
//}}EFSWizard_Action_2
//}}EFSWizard_Actions
Comment