Announcement

Collapse
No announcement yet.

Study in Wizard

Collapse
X
 
  • Filter
  • Time
  • Show
Clear All
new posts

  • Study in Wizard

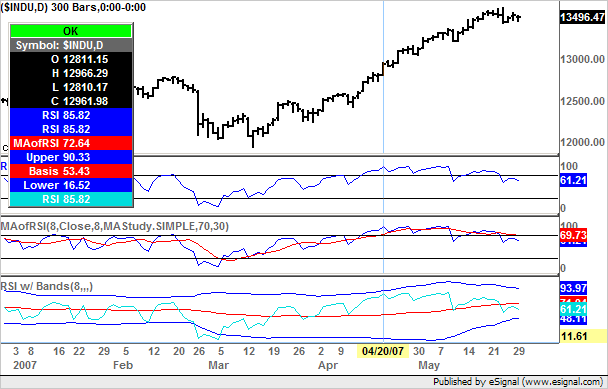
    Is it possible to create the below study in the wizard?

    Plot a 8 period RSI.

    Place a 8 period MA of the RSI

    Place a 20 period Bollinger Bands of the RSI

    All in the lower window?

    Bruce

  • #2
    I was able to find a MA of the RSI along with BB of the RSI.

    I've edited both to show the SI to set at 8 and I've overlapped both studies.

    BUT, the RSI is off. The readings are correct but the plotting is wrong.

    Any help would be appreciated.

    Bruce

    P.S. here is the MA of the RSI
    Attached Files

    Comment


    • #3
      here is the BB of the RSI.

      P.S. I've tried to post this 3 times so if it shows up multiple times my apologies
      Attached Files

      Comment


      • #4
        Bruce
        As far as I can see the values and the plots of the RSI returned by either script appear to be correct
        To answer the question you asked in the first post of this thread it is possible to write the complete study using the Formula Wizard. For an illustrated example of how to create studies on studies using the Formula Wizard see the Formula Wizard Guide in the EFS KnowledgeBase
        Alex

        Comment

        Working...
        X