Announcement

Collapse
No announcement yet.

Trying to create a Stoch formula

Collapse
X
 
  • Filter
  • Time
  • Show
Clear All
new posts

  • Trying to create a Stoch formula

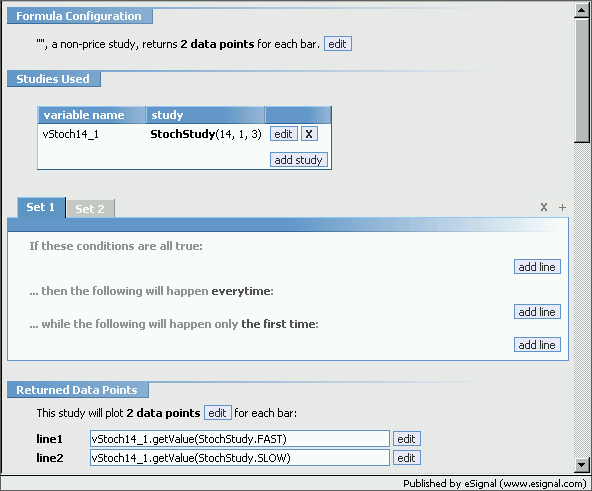
    trying to use Formula Wizard without success to create a Stochs study.

    I've selected Stochs study and set the numbers for the Fast and Slow and Smoothing.

    I get a seperate window pain on my chart but it is blank.
    No stoch lines showing...

    In Set 1 "if these conditions are true" I selected "close" for the left box and selected the Stoch study in right box.

    This is as far as I can get

    any help appreciated.

    Thx

  • #2
    Swan
    You may want to check the EFS Help Center and Library at the following link.
    http://www.esignalcentral.com/traini.../efs_database/
    There you should find a Formula Wizard Guide that should help set up your indicator.
    To answer your question, if the indicator pane is empty it could be because you have not set up your Returned Points, either in the Study Configuration where you set the parameters of the plots you want, or in the main window where you need to fill in the box (or boxes) in the Returned Data Points section of the Formula Wizard.
    Alex

    Comment


    • #3
      Swan
      Here is an example of the Returned Data Points I referred to in my prior message.
      The Set1, Set2 are to be used to set conditions on which you want certain actions performed (such as painting bars, issuing Buy/Sell orders, creating alarms or alerts etc)
      Alex

      Last edited by ACM; 05-31-2003, 10:53 AM.

      Comment


      • #4
        ...

        Comment


        • #5
          Swan
          Attached is an efs created using the Formula Wizard. It will plot a Stochastic indicator and set the background to Lime if the Fast is above the Slow and yellow if below.
          Open it with the Formula Wizard to see how the plots and the conditions were set
          Alex

          Attached Files

          Comment


          • #6
            Alex.

            Your help is much appreciated. Visuals say so much so easily..

            I have 2 lines

            Will now try to create Arrow alerts for crossovers

            Thx

            Swan

            Comment


            • #7
              Swan
              If you are trying to put arrows in the price chart then you cannot do that. For now an efs can plot either in the Price pane or in the Indicator pane but not in both.
              The one thing it can do though is plot an indicator in its own separate pane and paint the price bars at the same time.
              If you want arrows on the Price chart then you create the same Stoch study but set it to be a Price Study and without returning any data points. Then in the conditions you can set it to show Shapes, Images etc in the Price pane.
              Alex
              Last edited by ACM; 05-31-2003, 01:58 PM.

              Comment


              • #8
                Alex.

                Trying to create arrows in the indicator pane, not on the price chart.

                Have tried various combinations in the Set1 box and searched in library etc..nothing found..cannot find instructions for this.


                regards

                Swan
                Last edited by swan; 05-31-2003, 11:32 AM.

                Comment


                • #9
                  Swan
                  The Formula Wizard references colors by their RGB content and not by the color name (although it is also possible to use the color name in efs)
                  Click on the <EDIT> button in the "the following will happen every time" (in either Set1 and Set2) and you will see what color comes up.
                  That would be the same place where you would select the Shape (ie the arrow) instead of coloring the bar.
                  However if you want to signal the crossovers ONLY then you have to change the conditions.
                  Why? Because the conditions now say "IF the Fast is above THEN do this every time".
                  You would need to change that to "IF the Fast of 1 perod ago was below the Slow of 1 period ago AND the Fast of this period is above the Slow of this period THEN do this every time"
                  Alternatively you can leave the conditions as they are and move the action to "this will happen only the first time".
                  Irrespective please read what I just said in my earlier message about plotting arrows.
                  Again I suggest going through the guide I pointed out earlier and perhaps looking at some of the many examples of efs that are available in this Bulletin Board and/or at FileShare.
                  Some you will be able to open with the Wizard others you will need to look at with the Editor.
                  Alex
                  Last edited by ACM; 06-01-2003, 02:35 AM.

                  Comment


                  • #10
                    Swan
                    here is the efs that sets the conditions to signal ONLY the crossovers (see in the conditions how the Offset is used) then plots an up arrow at the value of 90 and the down arrows at the value of 10. You cannot use the High, Low etc because there is no price in an indicator window hence you need to use a value that is recognizable by the efs (ie in the Stch any number between 0-100)
                    Alex
                    Attached Files

                    Comment


                    • #11
                      ..
                      Last edited by swan; 05-31-2003, 12:04 PM.

                      Comment


                      • #12
                        Alex

                        Thx for the info..as you point out, the arrow alerts are set at 90 and -10. i have found a file with a MACD x over with arrow alerts positioned at the point of the x overs...

                        (no explination as to how to create these).

                        Are you saying that this is not possible to create arrow at the point of the x overs with Stochastics, even though they may be created with MACD..???

                        Swan

                        Comment


                        • #13
                          Swan

                          Are you saying that this is not possible to create arrow at the point of the x overs with Stochastics, even though they may be created with MACD..???

                          I did not say that. I just said I used a value recognizable by the efs and the easiest to pick were 10 and 90.
                          As you can see in the image below it is possible to place it right on either one of the Stoch values but it gets tricky on how to do it.


                          Not saying it is difficult but if you don't know how to set the parameters then it is not an easy task.
                          In the EFS help Center and File Library there is also a section that is dedicated to all the commands and functions used in efs. These come with examples and you may want to go through them.

                          Anyhow attached is yet another iteration of the efs that places the arrows at the Fast line.

                          Alex
                          Attached Files

                          Comment


                          • #14
                            Alex.

                            again my thx.

                            I do not wish for you to be repeating yourself..surfice it to say, I would have absolutely no idea how to do any of this without your input.


                            If I may ask..i followed your suggestion regards having the arrows on the Price pane rather than the Indicator Pane..

                            Doing what you suggest ie selectiing Price Pane and haveing no Return Data.. this seems to get rid of the Stoch lines and leaves the arrows still in the Indicator Pane...??

                            Regards

                            Swan

                            Comment


                            • #15
                              Swan
                              No, if you make it a Price study then the indicator pane disappears completely and the arrows will be plotted on the price chart at the levels you set them to.
                              In this case you would need to set them to the High or the Low of the bar because the reference point is now no longer the Stochastic value.
                              Alex

                              Comment

                              Working...
                              X