 Tweet
Tweet
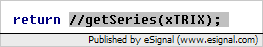
I downloaded amtrix.efs and have it in a subchart.
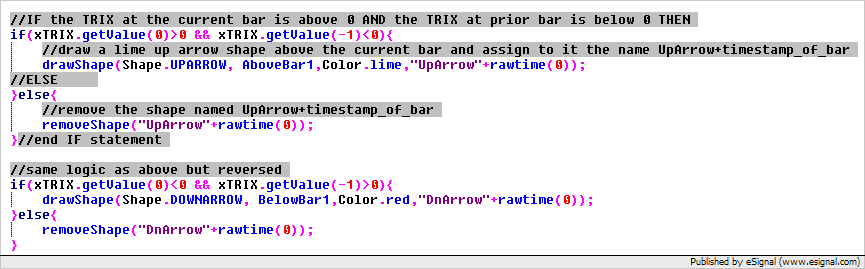
I want to draw arrows on my price chart when trix crosses the zero line:
down arrow for trix()<=0 and trix(-1)>0
up arrow for trix()>=0 and trix(-1)<0
I am new to this and am working with formula wizard and I do not see anyway to use trix.
I am using a trix length of 5, source = close, and show parameter = false.
Thanks in advance for any suggestions.

Comment