I am wondering if any one can help me. I have written a small efs using the formular wizard to show divergence signals on my indicators and with trend signal. The problem I am having is when I load the efs onto my charts it reads the signals and adds the correct symbols in the correct place but as candles are added to the charts it begins to become incorrect. If in then reload the efs it the adds the symbols and reads the indicators correctly. Then as time passes they become incorrect and I the reload and to correct and the cycle starts all over again. Is there anything that I can do?
Announcement
Collapse
No announcement yet.
Reload efs to get correction of signals
Collapse
X
-
Re: Reload efs to get correction of signals
icolley
The reason why you get some shapes drawn in real time which then disappear when the script is reloaded is because your conditions are evaluating to true at some point intrabar but then are no longer true once the bar is completed. However once the shape is drawn it remains on the chart even if the condition is no longer true (you would need to execute a specific command to remove it - more on this follows).
When you then reload the efs this runs through the historical bars and evaluates them as completed bars hence removing any false signals that were generated intrabar
Depending on your level of familiarity with programming in efs there are various solutions available to correct this
By far the easiest solution is to set the efs to execute only on completed bars. To do this open the efs with the EFS Editor (Tools-> EFS-> Editor in the main menu) and add the following line of code
setComputeOnClose();
in line 30 of the script.
Save the formula and reload it in the chart. Once you do that the efs will execute only when a bar is completed thereby avoiding any false signals that may be generated intrabar.
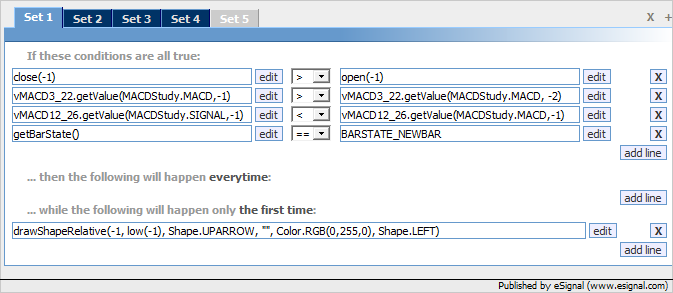
An alternative [the result of which is the same as the one above] is to modify each condition to evaluate only on the first tick of a new bar. To do this you would need to add to each set a condition that checks for BARSTATE_NEWBAR [ie the first tick of each new bar] and you would also need to change all your conditions to look at the values of the studies at the prior bar as shown in the example below which needs to be implemented in each set (note that you also need to modify the location where the shape is drawn)
Both these solutions will still allow you to continue to open and edit the formula using the Formula Wizard.

Another alternative is to rewrite parts of the script to add the necessary logic and commands to remove the drawn shapes when the conditions are no longer true. This solution however entails using the EFS Editor as it cannot be implemented using the Formula Wizard. Also once you modify the efs to include these changes you will no longer be able to edit the efs using the Formula Wizard
Alex
Originally posted by icolley
I am wondering if any one can help me. I have written a small efs using the formular wizard to show divergence signals on my indicators and with trend signal. The problem I am having is when I load the efs onto my charts it reads the signals and adds the correct symbols in the correct place but as candles are added to the charts it begins to become incorrect. If in then reload the efs it the adds the symbols and reads the indicators correctly. Then as time passes they become incorrect and I the reload and to correct and the cycle starts all over again. Is there anything that I can do?
Comment