Announcement

Collapse
No announcement yet.

Periods in Formula Wizard

Collapse
X
 
  • Filter
  • Time
  • Show
Clear All
new posts

  • Periods in Formula Wizard

    I am new to EFS and Formula Wizard. I have been using Metastock real-time w/ a E-signal feed.


    In Metastock, all standard formulas must use a "fixed" period in the "periods" field of the indicator. If you have another function that outputs a varying periods calculation (e.g., based on changing volatility), their standard formulas won't read them. You can put most anything (varying or fixed) in the data array reference field, but not the period field. I had to end up getting dlls written to handle this. That is no easy trick since they don't even have development partners "lined-up" to help. That is why I am thinking about switching to EFS.


    If I have a custom EFS that outputs a varying period, (e.g., bar #20 = 15, bar#21= 16, bar #22=14, etc) will the standard formulas in E-signal's formula language (e.g., moving average) allow me to read in this so that each bars indicator output is calculated based on "that" bars varying period and retained, that is bar20 calculates a MA based on 15 length & retains it, next bar[bar21] "that" bar's MA is calculated based on 16 length & retained --- by retained I mean each calculation is kept and pieced together in the plot. In other words, it doesn't retroactively recalculate the MA for all past bars based on the current bar's new "period" input.


    OR

    will I have to get custom EFS to read in my varying periods , and will formulas accept most any data array (e.g., another custom indicator as input, not just High Low Close,etc)?


    Thank you

  • #2
    Hello burgessx,

    You could create a varying periods MA formula but it would require some custom programming. We have some EFS functions that would allow you to build an array of price data based on your varying periods. You would then create a routine within the formula to calculate the MA.

    Each bar's returned result would retain that value for the life of the formula regardless of the period used on the subsequent bars and would be displayed as a continuous line.

    Your varying periods could be stored in the formula with some global variables or they could be read in from a text file.

    Formulas can be designed to use a custom array of data. The built-in study objects that require a price source (data source) accept, Open, High, Low, Close, HL/2, HLC/3, OHLC/4 or the data output of another built-in study. We refer to these as Study-on-Study formulas. You cannot pass a custom data array to a built-in study object.

    Let me know if you have any more questions.
    Jason K.
    Project Manager
    eSignal - an Interactive Data company

    EFS KnowledgeBase
    JavaScript for EFS Video Series
    EFS Beginner Tutorial Series
    EFS Glossary
    Custom EFS Development Policy

    New User Orientation

    Comment


    • #3
      Thank you for your answer

      To be sure I understand correctly, I could do the varying periods, but if I wanted to read in a custom indicator as data for further analysis --- I would have to write a separate custom formula so I might as well have the whole thing written in custom form for both data and periods?

      Are there any hard copy reference guides for learning EFS and the Formula Language functions. I don't like to constantly read & "jump" through screens. Books are sometimes much easier (carpal tunnel and all that)

      Also, do I need a compiler to write JavaScript custom EFS functions for use?

      Thank you
      Mike

      Comment


      • #4
        Hello Mike,

        Your varying period MA formula would require a custom formula and it could most likely be coded into a single formula.

        No compiler is required. To create custom formulas, you can use the EFS editor, which installs with eSignal, or any text editor.


        Once you have a completed formula, you simply save it to a folder within \eSignal\Formulas\. To apply it to an advanced chart, you simply right-click on the chart, select "Formulas," and navigate to the folder containing your formula.

        We don't maintain any hardcopy materials. EFS is evolving at a faster rate than we would be able to keep up with in a hard copy version. Please allow me direct you to our current resources.

        EFS Resources

        Your best option is to download the EFSHelp.chm tool developed by Divergence Software, Inc. This is a very helpful tool that categorizes all our EFS functions and has an alphabetical index as well. They also have a standard windows help version available. Visit their file share group, Specialty Scripts and go to the EFS Help File folder.

        You can also find the EFS reference information in our EFS Help Center & Library, which also has several guides and a library of EFS formulas.

        Keep in mind that these reference materials only cover our EFS extensions. EFS is actually an extended version of JavaScript 1.5. To learn more about core JavaScript functionality please visit the following resources.

        Core JavaScript Guide 1.5
        Core JavaScript Reference 1.5
        Jason K.
        Project Manager
        eSignal - an Interactive Data company

        EFS KnowledgeBase
        JavaScript for EFS Video Series
        EFS Beginner Tutorial Series
        EFS Glossary
        Custom EFS Development Policy

        New User Orientation

        Comment


        • #5
          Jason --

          a)Since I am new to EFS, the fact that these formulas do not need to be compiled, will that really slow my system down. I ran into that problem in Metastock before getting the dlls. I run DSL for internet, Windows XP, pentium III, 1.2mhz with 1 GIGABYTE RAM and a 7200 rpm hard drive

          b) How many custom indicators can I plot on a chart? I assume I can overlay some like MA and bands directly on price, and put rest of them in windows below price plot?

          c)Minor question --- I assume I can close all windows in E-signal display and display only price plot and indicators for ease of viewing?


          Thank you
          Mike

          Comment


          • #6
            Hello Mike,

            a) You have a faster system than I do. This won't be an issue for you. My understanding is that when you first apply a formula it gets interpreted to byte-code. The formula doesn't have to be reinterpreted or parsed on each execution. I hope that answers your question.

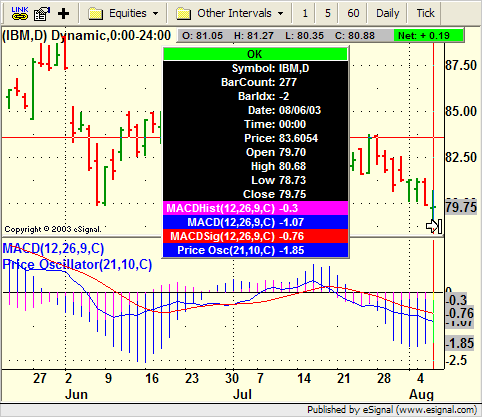
            b) I'm not sure what the exact limit is if there is one. You could put more formulas on a single chart than you could possible make sense of. Yes you can have multiple formulas running on the price window and multiple non-price formulas. With the non-price formulas you can stack them ...


            ... tile them ...


            ... or overlay them. If the overlayed studies don’t have a similar scale, the result isn’t too useful. Anyway, to overlay non-price studies, hold down the shift key and then click and drag one on to the other.


            c) Absolutely. You can also create different layouts and save them with different names so that you can switch back and forth between different views (or layouts).
            Jason K.
            Project Manager
            eSignal - an Interactive Data company

            EFS KnowledgeBase
            JavaScript for EFS Video Series
            EFS Beginner Tutorial Series
            EFS Glossary
            Custom EFS Development Policy

            New User Orientation

            Comment

            Working...
            X