 Tweet
Tweet
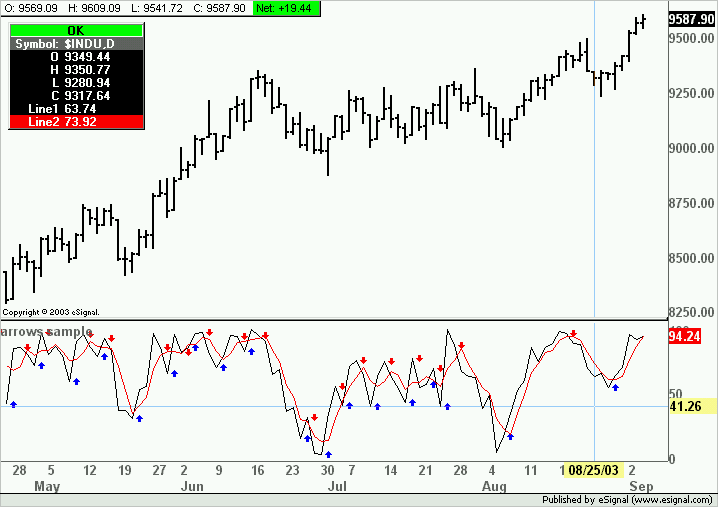
Have been searching the EFS help library for clues to why this simple Stochastic X-over Study built using the wizard, will not show arrows on a non price study. Alerts and sounds work fine. Is most likely something simple, but have not found it yet.
A Down load of the program is attached. The following is a copy of the Wizard Formula Configuration main set up screen for quick reference. Thanks for your help in advance.
Briank
Formula Configuration"", a non-price study, returns 2 data points for each bar. edit
vStoch14_3 StochStudy(14, 3, 3)
Set 1
if these conditions are all true:
vStoch14_3.getValue(StochStudy.FAST)>vStoch14_3.ge tValue(StochStudy.SLOW)
then the following will happen everytime: no entry
... while the following will happen only the first time:
Alert.addToList(getSymbol(), "Stoch Fast Crossing Up", Color.RGB(0,255,0), Color.RGB(195,0,0))
Alert.playSound("C:\\Program Files\\eSignal\\Sounds\\Ding.wav")
drawShapeRelative(0, low(), Shape.UPARROW, "", Color.RGB(0,255,0), Shape.TOP)
Set 2 is the same only <, arrow direction, sound and color.
Returned Data points
This study will plot 2 data points edit for each bar:
StochSlowLine
vStoch14_3.getValue(StochStudy.SLOW)
StochFastLine
vStoch14_3.getValue(StochStudy.FAST)
[ EFS script in following download.
Comment