Announcement

Collapse
No announcement yet.

Adding a crossover function from the wizard

Collapse
X
 
  • Filter
  • Time
  • Show
Clear All
new posts

  • Adding a crossover function from the wizard

    Hi
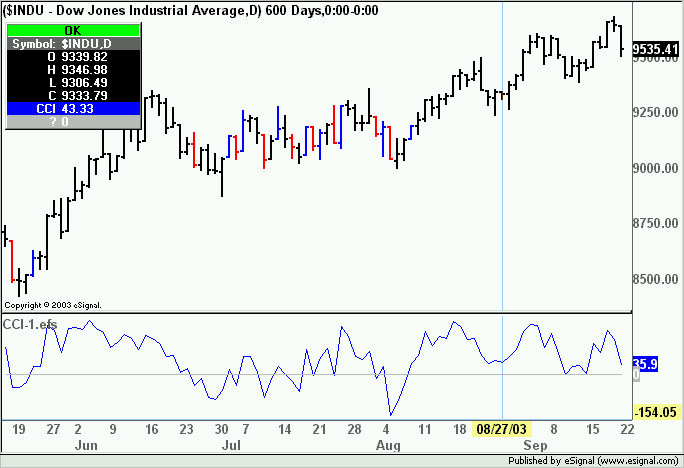
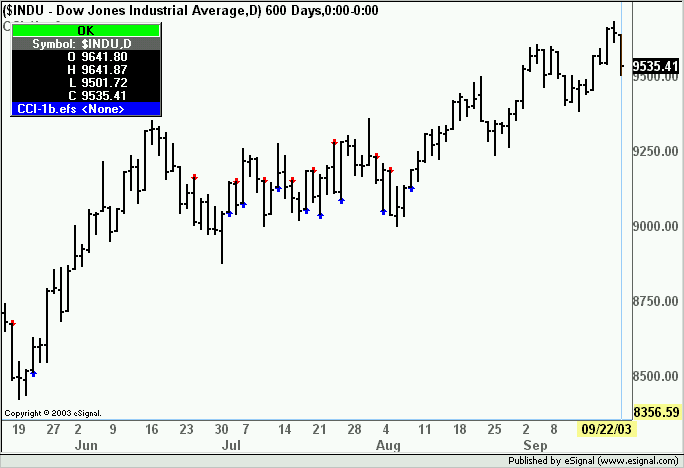
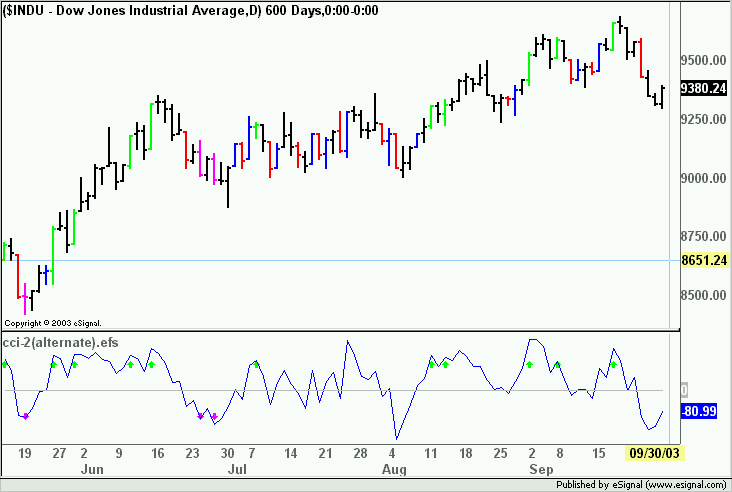
    I have been using the formula wizard for a few days now. I really like it, I even find it easier to use than EasyLanguage. On thing I have not figured out is say i want to have an indicator that everytime the cci crosses over 0 it with mark the bar. I tried to use the > < but it didn't work right. Does anyone have any thoughts on how I can make this work? Or any thing I can add to the code by hand?

    Thanks,
    chris

  • #2
    Chris
    In this and the following message you will find find two efs that show you how to achieve what you want. Open the efs(s) with the Formula Wizard and compare how the conditions are set differently but provide the same exact results.
    Note that if you are plotting an indicator as a non price study (ie in a separate pane) you cannot plot concurrently in the price pane. The only thing you can do is color the price bars.
    Alex

    Attached Files

    Comment


    • #3
      Chris
      Attached here is the alternate method
      Alex
      Attached Files

      Comment


      • #4
        Chris
        Lastly, if you do not plot the CCI as a separate indicator then you can apply arrows and other plots to the price chart.
        Hope these examples are of help.
        Alex

        Attached Files

        Comment


        • #5
          You've been a huge help. Thank you.

          chris

          Comment


          • #6
            Hi all,
            I am trying to add the +/- 100 cross to the indicator also and it is not working out right. Can someone take a look?

            Thanks,
            chris
            Attached Files

            Comment


            • #7
              Hi all,
              I got it to work by combining 2 efs files. One using shapes and the other paintbars. It doesn't seem to work as one efs. Is there any disadvantage to using more than one efs per chart?

              Thank you,
              chris

              Comment


              • #8
                Chris
                What is happening in your formula is that when the CCI is above (or below) 0 the conditions in Set1 (or Set2) are true hence the efs stops verifying for other conditions ie whether the CCI is above 100 or below -100. This is why you are not getting any signals for those levels.
                One solution would be to rearrange the formula as in the attached efs. In this case the conditions in Set1 and Set2 are true only when the CCI is crossing 0 which then allows the efs to look for other conditions such as the crossing of 100 (or -100).
                In the modified efs I have inserted the commands to paint the price bar and to plot a shape in the indicator window when 100 or -100 are crossed. Simply remove the one you do not want.
                Alex

                Attached Files
                Last edited by ACM; 09-30-2003, 03:28 AM.

                Comment

                Working...
                X