Announcement

Collapse
No announcement yet.

MA Signal

Collapse
X
 
  • Filter
  • Time
  • Show
Clear All
new posts

  • MA Signal

    I'm new to e-signal and have not written any formulas. Any suggestion will be greatly appreciated.

    I would like a signal, when one MA (adjustable) crosses another MA (adjustable).

    Thanks for any help.

    Al

  • #2
    Al
    If you are just beginning to write formulas may I suggest you use the Formula Wizard which will allow you to become familiar with both the construct and the syntax used in efs.
    The initial disadvantage is that the studies you will create will not be adjustable other than by editing them with the Formula Wizard itself which is relatively fast and easy anyhow.
    To answer your question, unless you need to have Weighted or Volume Weighted MAs then use the Price Oscillator Study in Formula Wizard.
    This will simplify the code because all you need to do is define the Oscillator crossing 0 to identify the crossover points of the two MAs.
    Alex

    Comment


    • #3
      MA Signal

      Alexis,

      I am not able to write it. I can't find librery/Keltner EMA in the list of available indicators.

      I'm trying to get a signal (up or down arrow or red or green arrow or square), when the 9 EMA crosses the Librery/Keltner EMA.

      Al

      Comment


      • #4
        Al
        The keltnerEMA.efs is nothing but a 10 period EMA of HLC/3.
        Run the keltnerEMA.efs on a chart then apply to the same chart a Basic Study MA with the parameters suggested above and you should see they overlay exactly.
        Alex

        Comment


        • #5
          MA Study

          Alexis,

          OK, I'm learning. I've got it written, but I have two problems.

          1) I requested a green or red arrow to be displayed on the right side of the chart. Instead of a single arrow , it displayed a row of red and green arrows and looks like some overlapped others. How can I correct that?

          2) I think I know where I went wrong here. The row of arrows where displayed over the last price bar. I think I saw is a place where it can be offset. Is that the way to correct that?

          Thanks,

          Al

          Comment


          • #6
            Check your code, you should be using

            drawShapeRelative

            This function is used to draw a shape on the chart. Unlike the drawShapeAbsolute() function, the shape will 'stick' to the x-axis position that it was originally written to. As new bars come in, the shape will shift to the left along with the bars.

            I had the same problem and found this was my problem

            Comment


            • #7
              MA Signal

              Thanks Tickler, I'll try that. I did use the absolute.

              Al

              Originally posted by tickler
              Check your code, you should be using

              drawShapeRelative

              This function is used to draw a shape on the chart. Unlike the drawShapeAbsolute() function, the shape will 'stick' to the x-axis position that it was originally written to. As new bars come in, the shape will shift to the left along with the bars.

              I had the same problem and found this was my problem

              Comment


              • #8
                MA Signal

                Tickler - Alexis

                OK, thanks for all your help.

                It's working properly, but there is one thing I would like to change.

                The arrows give the proper signal on each bar. Can it be changed so that it will give one signal on the right side of the chart not over and under each bar?

                Al

                Comment


                • #9
                  Al

                  Can it be changed so that it will give one signal on the right side of the chart not over and under each bar?

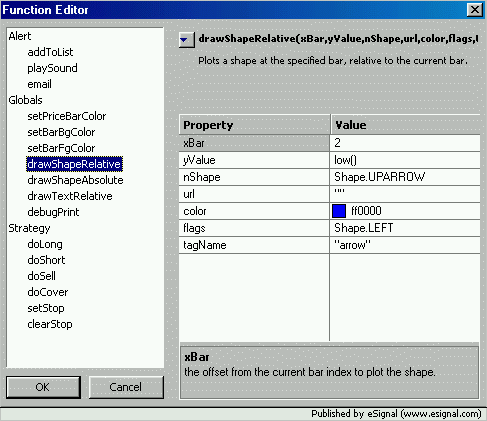
                  The example in the image shows you how you can do this.


                  It will plot a blue up arrow 2 bars forward from the current bar in line with the low of the current bar and because it has a unique tagName ie "arrow" it will only plot one instance of that shape.
                  Hope this helps

                  Alex

                  Comment


                  • #10
                    MA Signal

                    Alexis

                    That did it. Thanks so much.

                    As per your snap shot, I change the:

                    xbar-from 0 to 2
                    flags-from shape.right to shape.left(I'm confused about that), and
                    tag name from "" to "arrow"

                    What was it that fixed my problem. I would like to be able to do these thing on my own.

                    Regards,

                    Al

                    Comment


                    • #11
                      Al
                      By changing xBar from 0 to 2 you instructed the formula to plot the shape not on the current bar (which has an index of 0) but 2 bars forward.
                      The shape flag does not make that much difference in this case. Anyhow the right/left indicates whether the shape will be right-aligned or left aligned to the bar's center. As an example Shape.RIGHT means that the right edge of the shape will be in line with the center of the bar not that the shape itself will be to the right.
                      By assigning a tagName you define a shape as unique hence only the last one set by that condition will be plotted. If instead you left the tagName blank "" then every shape set by that condition would be plotted.
                      Hope this helps.
                      Alex

                      Comment

                      Working...
                      X