I used the Wizard to create an EFS to plot 5 MAs. Problem is: it wont plot the averages for the current bar.
Announcement
Collapse
No announcement yet.
Plot avg for current bar
Collapse
X
-
//{{EFSWizard_Description
//
// This formula was generated by the Alert Wizard
//
//}}EFSWizard_Description 7532
//{{EFSWizard_Declarations
var vSMA200 = new MAStudy(200, 0, "Close", MAStudy.SIMPLE);
var vSMA50 = new MAStudy(50, 0, "Close", MAStudy.SIMPLE);
var vSMA20 = new MAStudy(20, 0, "Close", MAStudy.SIMPLE);
var vSMA10 = new MAStudy(10, 0, "Close", MAStudy.SIMPLE);
var vSMA5 = new MAStudy(5, 0, "Close", MAStudy.SIMPLE);
var vLastAlert = -1;
//}}EFSWizard_Declarations 39881
function preMain() {
/**
* This function is called only once, before any of the bars are loaded.
* Place any study or EFS configuration commands here.
*/
//{{EFSWizard_PreMain
setPriceStudy(true);
setStudyTitle("Diane's MAs");
setCursorLabelName("MA200", 0);
setCursorLabelName("MA50", 1);
setCursorLabelName("MA20", 2);
setCursorLabelName("MA10", 3);
setCursorLabelName("MA5", 4);
setDefaultBarStyle(PS_SOLID, 0);
setDefaultBarStyle(PS_SOLID, 1);
setDefaultBarStyle(PS_SOLID, 2);
setDefaultBarStyle(PS_SOLID, 3);
setDefaultBarStyle(PS_SOLID, 4);
setDefaultBarFgColor(Color.RGB(00,00,0xC4), 0); // Dark Blue
setDefaultBarFgColor(Color.RGB(00,0x80,00), 1); // Dark Green
setDefaultBarFgColor(Color.RGB(0x80,00,0x80), 2); // Purple
setDefaultBarFgColor(Color.RGB(0xFF,56,0x80), 3); // Mauve
setDefaultBarFgColor(Color.RGB(0x00,0xCC,0x00), 4); // Green
setDefaultBarThickness(1, 0);
setDefaultBarThickness(1, 1);
setDefaultBarThickness(1, 2);
setDefaultBarThickness(1, 3);
setDefaultBarThickness(1, 4);
setPlotType(PLOTTYPE_LINE, 0);
setPlotType(PLOTTYPE_LINE, 1);
setPlotType(PLOTTYPE_LINE, 2);
setPlotType(PLOTTYPE_LINE, 3);
setPlotType(PLOTTYPE_LINE, 4);
//}}EFSWizard_PreMain 119457
}
function main() {
/**
* The main() function is called once per bar on all previous bars, once per
* each incoming completed bar, and if you don't have 'setComputeOnClose(true)'
* in your preMain(), it is also called on every tick.
*/
//{{EFSWizard_Expressions
//{{EFSWizard_Expression_1
//}}EFSWizard_Expression_1 0
//}}EFSWizard_Expressions 9063
//{{EFSWizard_Return
return new Array(
vSMA200.getValue(MAStudy.MA),
vSMA50.getValue(MAStudy.MA),
vSMA20.getValue(MAStudy.MA),
vSMA10.getValue(MAStudy.MA),
vSMA5.getValue(MAStudy.MA)
);
//}}EFSWizard_Return 24907
}
function postMain() {
/**
* The postMain() function is called only once, when the EFS is no longer used for
* the current symbol (ie, symbol change, chart closing, or application shutdown).
*/
}
//{{EFSWizard_Actions
//{{EFSWizard_Action_1
function onAction1() {
vLastAlert = 1;
}
//}}EFSWizard_Action_1 5589
//}}EFSWizard_Actions 15622
Comment
-
pj909
As far as I can see the formula is plotting in real time.
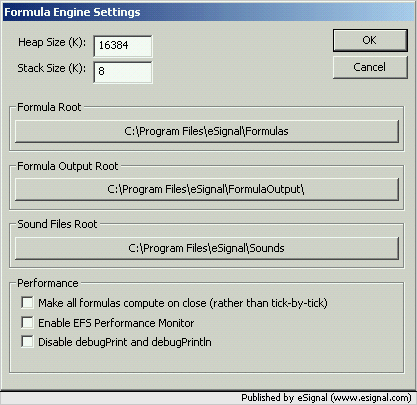
You may want to verify your EFS Settings. Click Tools->EFS->Settings... and make sure that Make all formulas compute on close(rather than tick by tick) in the Performance section is unchecked.
You will need to restart eSignal for the change to go into effect
Alex
 .
.
Comment
Comment