Announcement

Collapse
No announcement yet.

conditional plotting

Collapse
X
 
  • Filter
  • Time
  • Show
Clear All
new posts

  • conditional plotting

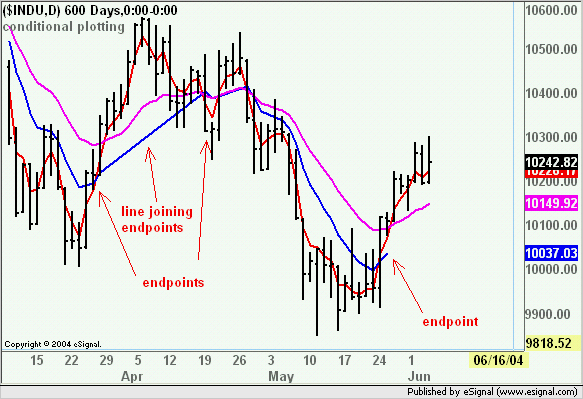
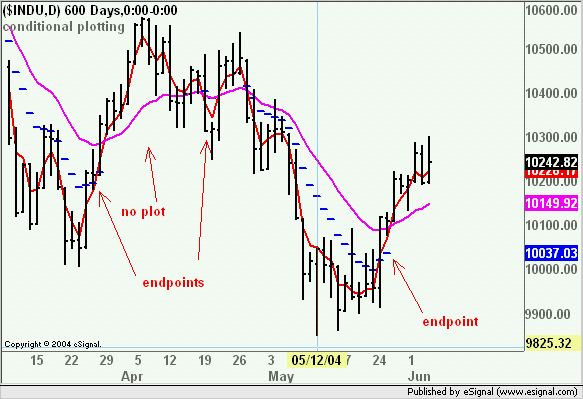
    Hi. Using the Formula Wizard I have developed a study that generates multiple solid line plots within the same pane. Is it possible to have one or more of those indicators temporarily but entirely disappear (that is, not be plotted) when they do not meet certain conditions and then reappear when they do meet those conditions? I realize an alternative to making it disappear would be to change its color to the background color, white. But there are two problems with this: First, only that portion of the plot which does not meet the conditions will go white, leaving an intermittent line which delivers screen cluttering, non-relevant visual information. Second, when the indicator does go white it often obscures the relevant indicators at crossover points. Any suggestions? Thanks.

    Michael Helms
    Last edited by mikejhelms; 06-05-2004, 05:26 PM.

  • #2
    Michael
    It can be done but not with the Formula Wizard alone.
    Also the result will depend on the type of plot that you are using. For example if you use PLOTTYPE_LINE the plot will disappear so long as one of the endpoints does not (yet) exist or is off the chart but as soon as both endpoints are on the chart the line will be joined (see following image)


    This chart is using the attached efs. The condition for the blue line (10 period EMA) to plot is that the red line (3 period EMA) must be below the magenta line (20 period EMA).
    As you can see the current condition has the red line above the magenta so the blue line is not plotted. However, when the red line will return under the magenta you will have the same effect shown earlier in the chart ie the two endpoints will be joined by a straight line.

    If however you use a non-continuous plot such as PLOTTYPE_DOTS or _FLATLINES or _HISTOGRAM then the plot will actually disappear (see next image)


    To see this effect replace line 22 in the attached efs with the following
    setPlotType(PLOTTYPE_FLATLINES, 1);
    Hope this helps
    Alex
    Attached Files

    Comment

    Working...
    X