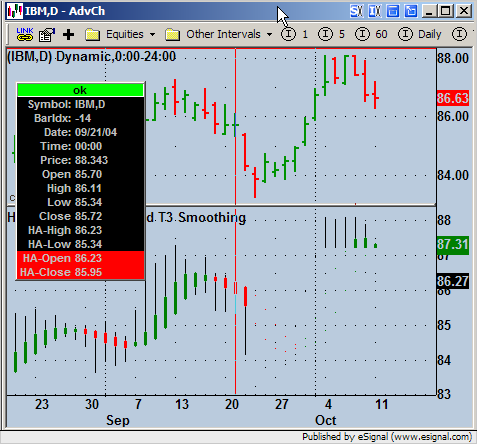
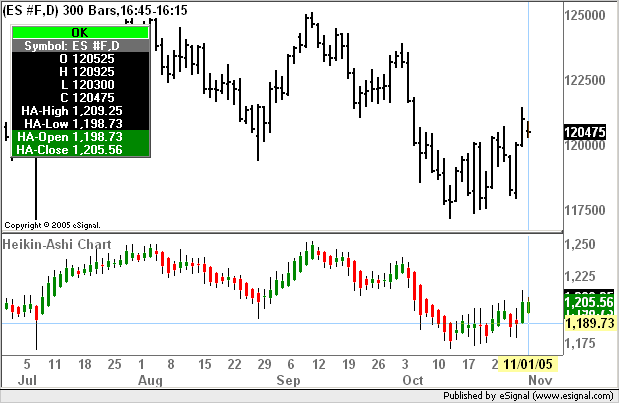
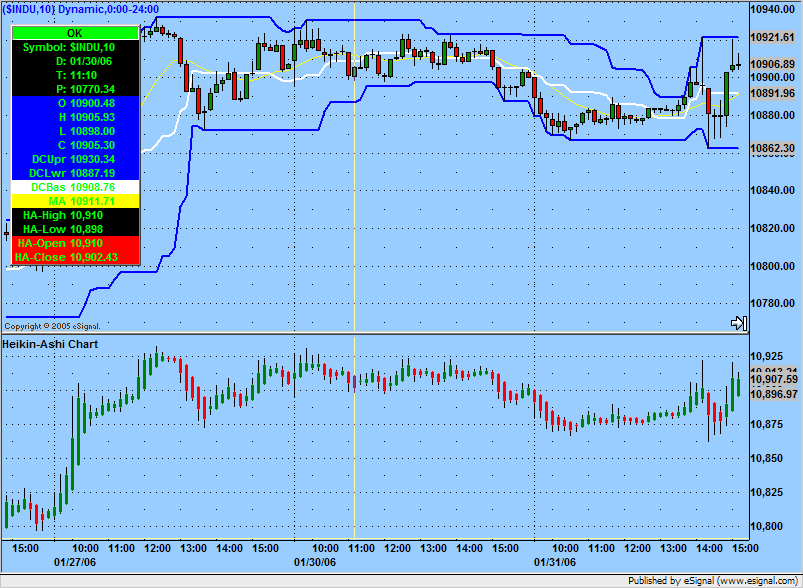
There appears to be some sort of a display peculiarity with Heikin-ashi charts - love them by the way and thanks for all the "variations" you have produced.
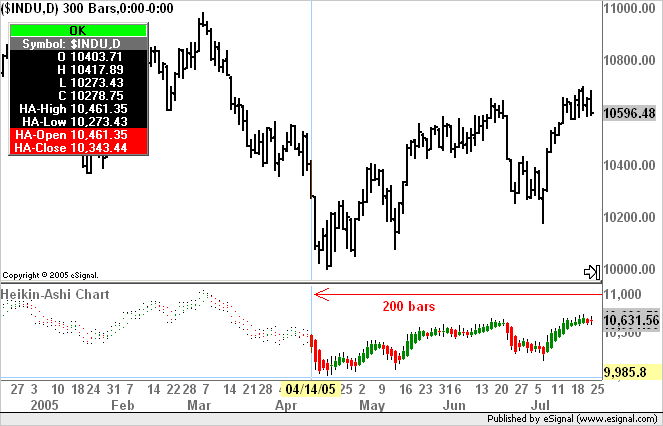
I have no problem producing Heikin-ashi charts and they seem very effective. I am also aware of the limitation in displaying >200 bars as currently specified within the efs. However, if you open another window partially over a Heikin-ashi chart, the Heikin-ashi display seems to simply disappear to just a series of "foggy" dots, especially if you pass the cursor anywhere over the partially obscured Heikin-ashi chart window. This also happens if a non-eSignal window is opened over a Heikin-ashi chart. If that eSignal or non-eSignal window is then removed, the Heikin-ashi chart still appears as a series of dots but the full display will re-appear just by passing the cursor over the Heikin-ashi chart - you only have to pass the mouse over the display, not even click the mouse. Is there a specific reason for this display problem since it does not occur with normal candlestick charts or any other eSignal charts?
Thanks
blackhawk


Comment