Announcement

Collapse
No announcement yet.

Bid Ask Size Plot on Advanced Chart

Collapse
X
 
  • Filter
  • Time
  • Show
Clear All
new posts

  • #31
    Hello laocoon,

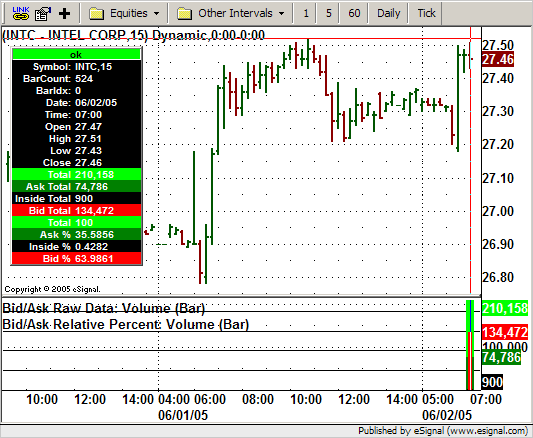
    Using BidAskAnalysis.efs, if you go into Edit Studies and select the "Relative Percent" option for the Study Output parameter (second from top) you should get the result you are looking for.
    Jason K.
    Project Manager
    eSignal - an Interactive Data company

    EFS KnowledgeBase
    JavaScript for EFS Video Series
    EFS Beginner Tutorial Series
    EFS Glossary
    Custom EFS Development Policy

    New User Orientation

    Comment


    • #32
      great, that does it....thanks a lot

      Cheers

      Comment


      • #33
        Hi JasonK

        I'm using the BidAskVolume.efs study and it works perfectly. I'd like however to enhance it a little by having the AskVol, InsideVol and BidVol figures in absolute numbers AND in percent of total volume displayed next to each other IN THE CURSOR WINDOW. Is that possible?

        Thanks a lot.
        Last edited by laocoon; 06-02-2005, 06:43 AM.

        Comment


        • #34
          Hello laocoon,

          This can be accomplished using the BidAskAnalysis.efs study.

          1. Apply the formula to an Advanced chart twice.
          2. Go to Edit Studies and set one of them to Relative Percent for the Study Output parameter. Also, set the Display parameters to No for all four outputs.
          3. Set the display options for the same study (bottom of Study Properties window) to No Display and No Scale.
          4. Click OK and close the Study Properties window.
          5. While holding down the shift key, click and drag the study over the other BidAskAnalysis study.

          You should see the following result.

          Jason K.
          Project Manager
          eSignal - an Interactive Data company

          EFS KnowledgeBase
          JavaScript for EFS Video Series
          EFS Beginner Tutorial Series
          EFS Glossary
          Custom EFS Development Policy

          New User Orientation

          Comment


          • #35
            great, that does it...thanks a lot for your quick answer.

            Regards

            Comment


            • #36
              Jason, there is something I'm not clear with about BidAskAnalysis.efs: I thought the EFS main() function was triggered only at the end of each bar plotted on the chart, that is at the end of each chart period (every 1 minute, 5 minutes...).

              Is it main() triggered after each sale instead?

              The difference is important because in the first case we would have an histogram of only the last bid/ask/inside transactions for each period.

              Comment


              • #37
                Hello probtrader,

                The main() function will be executed on every trade when processing real time data. An EFS can be configured to compute only on the close of a bar in two ways. setComputeOnClose() can be added to the preMain() function, or the Formula Engine Settings (Tools-->EFS-->Settings) can have the "Make all formulas compute on close (rather that tick-by-tick)" option turned on.

                If you are only seeing one execution per bar for this formula, you may have the global compute on close option checked in the Formula Engine Settings.
                Jason K.
                Project Manager
                eSignal - an Interactive Data company

                EFS KnowledgeBase
                JavaScript for EFS Video Series
                EFS Beginner Tutorial Series
                EFS Glossary
                Custom EFS Development Policy

                New User Orientation

                Comment


                • #38
                  BidAskAnalysis History

                  Just checking to see if there is any way of holding the history of the BidAskAnalysis

                  Comment

                  Working...
                  X