Announcement

Collapse
No announcement yet.

2005 Feb: The Truth About Volatility

Collapse
X
 
  • Filter
  • Time
  • Show
Clear All
new posts

  • 2005 Feb: The Truth About Volatility

    Jason:

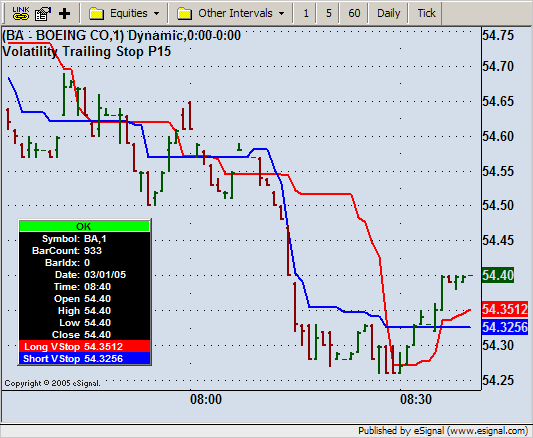
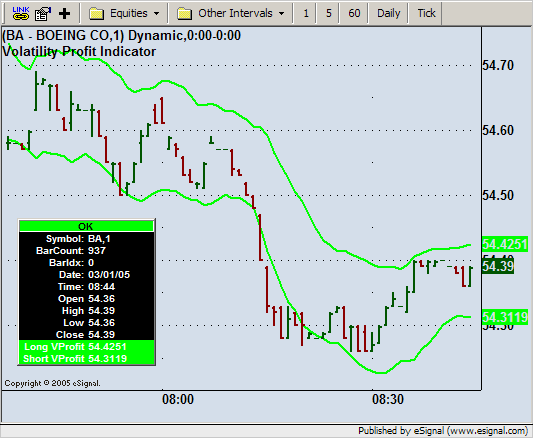
    When I try to download each EFS, it appears that each of the links below all download just the VolatilityEntryAdvisor EFS. It may be from my side but I can't get anything but the one EFS.
  • #2
    AllenCook
    Should be fixed now. Try downloading it again
    Alex

    Comment


    • #3
      Alexis,

      How would i go about writing the formula to signal a trigger if the volatility entry advisor goes from a red bar to a blue bar? I have no knowledge of EFS and though i have been looking at the bulleting boards, i have yet to make any inroads.

      Any help would be most appreciated.

      Regards

      David Dunne

      Comment


      • #4
        David
        The attached revision will trigger a sound alert when at the completion of a bar the color has changed.
        All changes are commented in the script
        Alex
        Attached Files

        Comment


        • #5
          Alexis,

          Thank you very much for both your assistance as well as the speed of your response.

          Kind regards,

          David Dunne

          Comment


          • #6
            It seems like there is an error in the EFS, some of the bars on the chart will change color if the chart is refreshed.

            Comment


            • #7
              Attached, it does this on every chart I attach it to, just let it run for an hour or so, refresh and multiple bars will change color.

              Regards
              Attached Files

              Comment


              • #8
                Hello BakedWafer,

                I've been looking into this a bit and haven't been able to reproduce the scenario you've described. What symbol and interval is being used in the chart examples you posted? Also, what was the time stamp for the bar that changed color after reload?
                Jason K.
                Project Manager
                eSignal - an Interactive Data company

                EFS KnowledgeBase
                JavaScript for EFS Video Series
                EFS Beginner Tutorial Series
                EFS Glossary
                Custom EFS Development Policy

                New User Orientation

                Comment


                • #9
                  Just let me stop and commend you on the work you do on these boards. I watch you day in and day out help people, so thank you for your quick responses.


                  I am currently using this script on a 5 minute YM, AB, ES, NQ chart, all of the charts seem to exhibit the same pattern. Let the chart run for awhile in realtime (an hour or so) and then refresh the chart. If you look carefully you will see some of the bar(s) will swap colors, it's frustrating if backtesting and knowing that the results are not legitimate. Thanks again for all your help!

                  Regards

                  Comment


                  • #10
                    Hello BakedWafer,

                    Thank you for the compliment.

                    I would still like to know the specific time stamp, symbol and interval in the chart images you posted. I want to download the tick data for that day and test the formula against that specific bar.
                    Jason K.
                    Project Manager
                    eSignal - an Interactive Data company

                    EFS KnowledgeBase
                    JavaScript for EFS Video Series
                    EFS Beginner Tutorial Series
                    EFS Glossary
                    Custom EFS Development Policy

                    New User Orientation

                    Comment


                    • #11
                      Originally posted by JasonK
                      Hello BakedWafer,

                      Thank you for the compliment.

                      I would still like to know the specific time stamp, symbol and interval in the chart images you posted. I want to download the tick data for that day and test the formula against that specific bar.
                      The time stamp for YM #F was 14:40; interval is 5 minutes. This is the only one I can give you at the moment as I didn't document it during the day but it did happen multiple times on AB, ES and NQ. I will document it tomorrow with all the times.

                      Regards

                      Comment


                      • #12
                        Hello Bakedwafer,

                        I've seen the problem now. There are some scenarios that occur in real time that the original rules from the article do not account for. The article examples are only evaluating completed bars on an end of day basis. I should have put setComputeOnClose() in the EFS so that the rules will be evaluated in the same manner for real time analysis as the EOD rules from the article. However, you're not limited to the setComputeOnClose() solution. Another alternative would be to add some additional rules to cover real time analysis. One suggestion might be simply to change the logic for coloring the bars like below. Feel free to make your own custom version.

                        PHP Code:
                        // starts at line 74
                            
                        if (vEntryLine) {
                                
                        vColor Color.blue;
                            } else if (
                        vExitLine) {
                                
                        vColor Color.red;
                            } else {
                                
                        vColor = (Color.grey);
                            }
                            
                        setPriceBarColor(vColor); 
                        Jason K.
                        Project Manager
                        eSignal - an Interactive Data company

                        EFS KnowledgeBase
                        JavaScript for EFS Video Series
                        EFS Beginner Tutorial Series
                        EFS Glossary
                        Custom EFS Development Policy

                        New User Orientation

                        Comment


                        • #13
                          Possible Lag?

                          Hello Jason:

                          Thank you for taking the time to put these indicators together. I know they take alot of time and work.

                          I have been playing with the volatility stop and I noticed something on my charts. It seems when the market is moving up that the trailing stop is very tight to the market action. However when the market is moving down it seemed that the gap between the stop line and the market is much much wider before it begins to tighten. This possibly a error in the code? Example would be in the russell minis I have noticed that if the market was on a short the market would be as much as 2 full points before the stop would begin to drop. However on the long side of the market it would be increasing after only a .8 point move.

                          Thanks for any help you can provide.

                          Vince B

                          Comment


                          • #14
                            Hello Bubby,

                            The article only covered long entry and exit logic. However, by using the reverse logic for the short positions we can add an extra indicator to the profit and trailing stop studies. Try the modified versions below.

                            VolatilityTrailingStopP15b.efs
                            This version now displays a second blue line that can be used for short positions trailing stops.


                            VolatilityProfitIndicator2.efs
                            This version now has a second profit line below the price action that can be used for profit taking with short positions.

                            Jason K.
                            Project Manager
                            eSignal - an Interactive Data company

                            EFS KnowledgeBase
                            JavaScript for EFS Video Series
                            EFS Beginner Tutorial Series
                            EFS Glossary
                            Custom EFS Development Policy

                            New User Orientation

                            Comment


                            • #15
                              thank you so much!!!!!!! you wouldnt by chance know of an indicator that might help recognize chops and congestion during a trading day?

                              Vince B

                              Comment

                              Working...
                              X