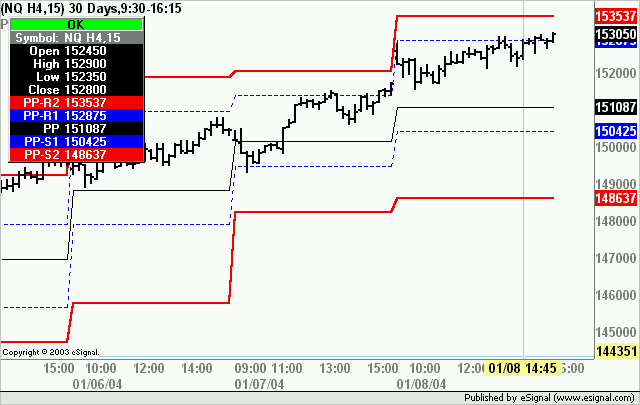
Jay in checking this formula against manual calc.s it seems that the formula is reading the second bar instead of the first on the open. Is this a problem on my end or a bug?
Announcement
Collapse
No announcement yet.
Woodie Pivots
Collapse
X
-
I matched the values with those on various message boards, and they seem to match. What symbol are you using? What are the values you see, and what was hand-calc'c?Regards,
Jay F.
Product Manager
_____________________________________
Have a suggestion to improve our products?
Click Support --> Request a Feature in eSignal 11
-
the problem is that the traders in woodie's room are using the 9:30-16:15 timeframe to get yesterday's high and low. The woodiespivot EFS is set to use only 9:30-16:00 and I haven't found a way to change it even when I set my time template to 9:30-16:15. It seems to be written into the EFS to use only the cash market time. This accounts for the difference between the pivot value calculated by eSignal and the value calculated by traders in woodie's room.
For example, on 1/7/04, NQ made a new high of 1517.50 in the 15m after the close of the cash market (vs. 1516.00).
I haven't been able to fix the woodiepivot EFS, but I tried to modify the default floor pivot study that comes as a default. It seems to respect changes in time templates (while the woodiepivot EFS does not at all) but I haven't been able to achieve the desired results.
I have attached a version of the basic pivots study that is modified to use woodie's formula [(H+L+O+O)/4] instead of the floor formula. I can't understand why it isn't working b/c it does show changes in the pivot for wider changes in the time template (such as 24 hours) if they have different highs or lows than were achieved during cash trading.
Maybe someone more experienced with EFS can take a look at this file and understand why it wont pick up that last 15m.Attached Files
Comment
-
shortswing
Unless I am misunderstanding your point it seems to me the efs you posted is including the 1517.50 High of 1/7/04.
PP for 1/8/04 would be (1517.5+1493+1516.5+1516.5)/4 = 1510.875 which is what the efs is plotting on my chart (see below).
Alex

Comment
-
Thank you for responding Alexis.
I'm sorry, I wasn't clear enough. The formula for woodie's pivotpoint is:
[(Yesterday's High + Yesterday's Low + 2*(Today's Open)/4]
Yesterday's High and Yesterday's Low are during the 9:30-16:15 time template. Therefore: the correct woodie pivot for the NQ for 1/8/04 would be:
(1517.50 + 1493.00 + 1526.00 + 1526.00)/4 = 1515.625
This was the pivot that all of the traders in woodie's room were using.
The key is that you use the High and the Low from 1/7/04 but you use the opening price (at 9:30) from 1/8/04. The opening price for NQ on 1/8/04 was 1526.00. That's the difference.
I'm not sure where you got the value 1516.50 that appears in your calculations, but that appears to be where the difference is.
Is there a way to have an eSignal EFS that calculates woodie's pivot in the correct way and over the correct time template?
Thank you,
shortswing
Comment
-
shortswing
My values were from the daily bar for NQ H4
I think Jason or Jay have coded a Pivot study that uses specific start/end times but I can't find it. In the mean time you could use NQ H4=2 as the symbol and that should return the values you are showing
Alex
Comment
-
Hi Alexis,
I was also struggling with what was causing the wrong numbers in the pivot efs. I tried your fix and it does give the correct pivot point when I add "=2" to the symbol.
2 questions: First, what exactly does the =2 do? Secondly, is there a way to modify the efs to give the correct value without adding the =2?Cheers!
Matt
Comment
-
Matt
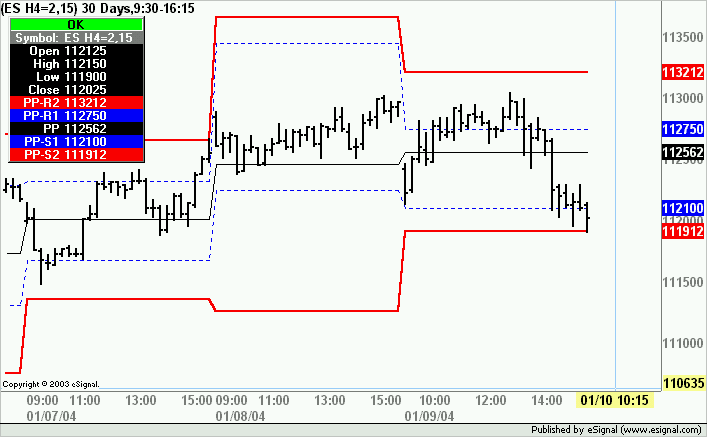
The =2 suffix when added to some CME Index futures symbols (such as ES and NQ for example) instructs them to use only the pit session trading hours (ie 8:30-15:15 CT).
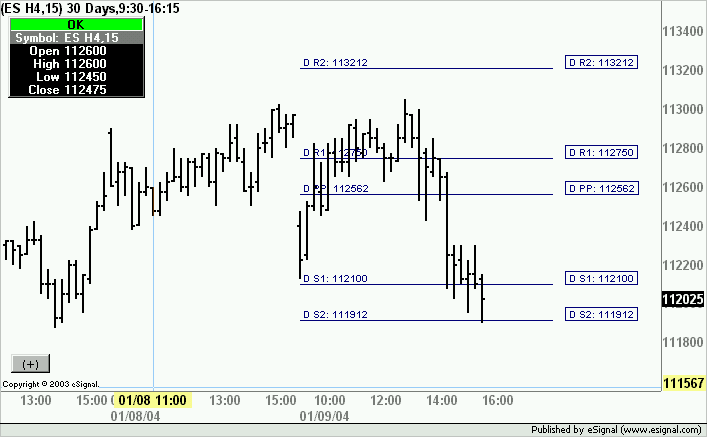
As to your second question you may want to try Chris Kryza's Pivot Console. Although it does not plot historical values it is the swiss army knife of pivot studies. It includes Woodie's Pivots and can be set to use RTH.
As an example see the following images. The first one shows the plot from woodiepivots.efs on ES H4=2 and the second the plot from the Pivot Console using ES H4.
You can find Pivot Console by clicking here
Alex


Comment
-
Alex,
Thanks for the explanation. You're right about "some" symbols. I have been frustrated with YM, YH, and AB this morning, trying to figure out why I don't have a plot when I add the =2. You just explained it.
I like the look of the console and will give it a shot.Cheers!
Matt
Comment
-
Alex,
The pivot console is great. I do have one problem though. (You knew that was coming!) Is there a way to make the efs look at the Day Session Only for a symbol. YH, YM and AB to be specific. I have restricted the Time view using Time Template to my local Day session, but the Pivpt Console efs still pulls the previos day high and low from the entire session, including the night session.
If you look at the YM H4 for today, the console gives a Woodie pivot of 10461 when it should be 10458.25. From what I can see as I scroll backwards through the data, the console gives a High of 10574, which did not occur during the day session.
Live Support says there isn't an equivalent day only contract symbol for these 3 symbols like there is for ES and NQ.
Perhaps you already gave me the answer. What is RTH? I'm drawing a blank. Regular Trading Hours?
Thoughts?Last edited by mattsb; 01-12-2004, 07:42 AM.Cheers!
Matt
Comment
-
Matt
In looking at the script it seems that it is using the =2 symbol to extract the required values when the RTH option is switched on. As Live Support told you the =2 suffix does not apply to YH, YM or AB which means that the Pivot Console will not return the pivots based on RTH only.
At this point a solution (if available) will have to come from Chris as he wrote the efs.
With regards to RTH that stands for Regular Trading Hours
Alex
Comment
-
Woodies Pivots
Hi:
I pulled these "Woodie Pivots" off the Web:
The 3 ways woodie calculates Pivot Points and Resistance/Support levels.
1) The woodie method:
PP = (YesterdaysHigh + YesterdaysLow + (TodaysOpen x 2)) / 4
R1 = (PP x 2) - YesterdaysLow
S1 = (PP x 2) - YesterdaysHigh
R2 = PP + R1 - S1
S2 = PP - R1 + S1
R3 = PP + R2 - S2
S3 = PP - R2 + S2
2) Moving Average Pivot method:
PP = 10 day Simple Moving Average of (TodaysClose - YesterdaysClose)
R1 = TodaysClose + PP
S1 = TodaysClose - PP
R2 = TodaysClose + (2 x PP)
S2 = TodaysClose - (2 x PP)
R3 = TodaysClose + (3 x PP)
S3 = TodaysClose - (3 x PP)
3) Fibonacci Resistance/Support Levels method:
R1 = YesterdaysClose + ((YesterdaysHigh - YesterdaysLow) x .618)
S1 = YesterdaysClose - ((YesterdaysHigh - YesterdaysLow) x .618)
R2 = YesterdaysClose + ((YesterdaysHigh - YesterdaysLow) x 1.236)
S2 = YesterdaysClose - ((YesterdaysHigh - YesterdaysLow) x 1.236)
R3 = YesterdaysClose + ((YesterdaysHigh - YesterdaysLow) x 1.854)
S3 = YesterdaysClose - ((YesterdaysHigh - YesterdaysLow) x 1.854)
I have found the Woodies Pivots - efs (thank you) & I am wondering if the other pivots can be coded?
Pivots already coded in fileshare:
[URL=http://share.esignal.com/groupcontents.jsp?folder=Pivots&groupid=84]
Thank you for your consideration.
HarndogLast edited by Harndog; 03-04-2004, 09:22 PM.
Comment
Comment