Announcement

Collapse
No announcement yet.

symOverlay2.efs

Collapse
X
 
  • Filter
  • Time
  • Show
Clear All
new posts

  • symOverlay2.efs

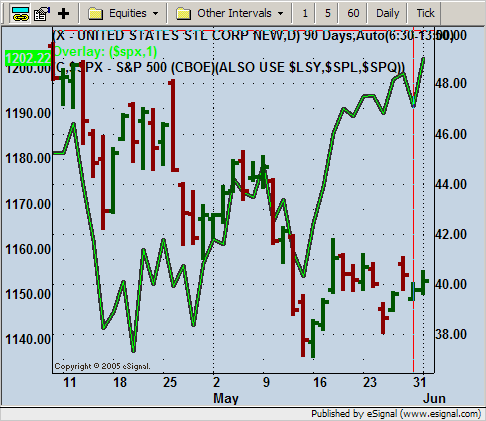
    Maybe its me, but the default overlay ISN'T $SPX.

    Also, when I'm trying to overlay $TICK on the ESM3, the scale is totally out of wack. I can't seem to keep the scale of the e-mini and properly overlay the $TICK.

    P.S. I'm using Beta build 577.

  • #2
    JT
    The plot seems to be that of $SPX (see attached).
    The problems you are having with $TICK overlayed on ES M3 could be caused by using a Time Template for ES which has an extra 15 minutes of trading time.
    If so try using 9:30-16:00 (or equivalent if in different time zone) and you should see them synced again.
    Alex
    Attached Files
    Last edited by ACM; 04-19-2003, 03:21 PM.

    Comment


    • #3
      symbol overlay.

      Jason Hey really like your symbol voverlay study. works and looks great. Was wondering would there be a way to set an alert for any two symbols that i put in the chart for: when they both reach the same price at anygiven time. App a reply thanks. Matt

      Comment


      • #4
        Hello Matt,

        Yes there is, but you might want to have the alert trigger when they are within a certain amount rather that the exact same price. That might not occur very often. Add something like below before the return statement at the end of main().

        PHP Code:
        if (Math.abs(v-close(0)) <= 0.25) {
            
        Alert.playSound("ding.wav");

        Jason K.
        Project Manager
        eSignal - an Interactive Data company

        EFS KnowledgeBase
        JavaScript for EFS Video Series
        EFS Beginner Tutorial Series
        EFS Glossary
        Custom EFS Development Policy

        New User Orientation

        Comment


        • #5
          alert

          Not real good at writing programs or adding to formula's hahaha. im afraid of screwing something up.But when you say add , are you meaning to add that writing to the formula itself. Thanks Matt

          Comment


          • #6
            Hello Matt,

            That's correct. Open your copy of the formula with the EFS Editor (Tools-->EFS) and save it with a new name. Then copy and paste the code snippet I provided just before the return statement in function main(). Save and test the formula and then tweak it to your liking. The complete code should look like below.

            PHP Code:
            /*******************************
            Provided By : eSignal. (c) Copyright 2003
            *******************************/
            var vLoaded false;

            function 
            preMain() {
                if (
            vLoaded == false) {
                    
            setPriceStudy(true);
                    
            setDefaultBarThickness(2);
                    
            setDefaultBarFgColor(Color.green);
                } else {
                    
            setCursorLabelName(vSymbol);
                    
            setStudyTitle("Overlay: ");
                }
            }

            var 
            vSymbol "";
            var 
            vSym "";
            var 
            vInterval 0;
            var 
            str = new String();
                
            function 
            main(nSymbolnFactor){
                if (
            vLoaded == false) {
                    if (
            nSymbol == null)
                        
            nSymbol "$SPX";
                    
            vInterval getInterval();    
                    if (
            nFactor == null) {
                        var 
            close();
                        if (
            == null) {
                            return;
                        }
                        var 
            c1 close(01nSymbol);
                        if (
            c1 == null) {
                            return;
                        }
                        
            nFactor = (c/c1);
                        
            nFactor *= 10000
                        nFactor 
            Math.round(nFactor);
                        
            nFactor /= 10000
                        str 
            nFactor;
                    } else {
                        var 
            vFactor nFactor+'';
                        var 
            strLength vFactor.length
                        
            var de false;
                        for (
            0strLength; ++i) {
                            
            str += vFactor.charAt(i)
                            if (
            vFactor.charAt(i) == ".") {
                                
            de true;
                            }
                        }
                        if (
            de == false) {
                            
            str += ".0"
                        
            }
                    }
                    
            vSym = (str nSymbol "," vInterval);
                    
            vLoaded true;
                    
            vSymbol = (str " x " nSymbol);
                    
            preMain();
                }
                
                var 
            close(01vSym);
                if (
            == null) {
                    return;
                }

                if (
            Math.abs(v-close(0)) <= 0.25) {
                    
            Alert.playSound("ding.wav");
                }

                return 
            v;

            Jason K.
            Project Manager
            eSignal - an Interactive Data company

            EFS KnowledgeBase
            JavaScript for EFS Video Series
            EFS Beginner Tutorial Series
            EFS Glossary
            Custom EFS Development Policy

            New User Orientation

            Comment


            • #7
              alert

              ok i did that now. how do i turn the alert on or set it? Thanks Matt

              Comment


              • #8
                Hello Matt,

                You're all set. When the alert condition evaluates to true, an audible alert will be triggered.
                Jason K.
                Project Manager
                eSignal - an Interactive Data company

                EFS KnowledgeBase
                JavaScript for EFS Video Series
                EFS Beginner Tutorial Series
                EFS Glossary
                Custom EFS Development Policy

                New User Orientation

                Comment


                • #9
                  alert

                  keeps sayin syntex error. Says line 15 v has no value. what ever that means Matt

                  Comment


                  • #10
                    Hello Matt,

                    Please post your formula using the attachment feature when replying. I'll take a look and see what's missing.
                    Jason K.
                    Project Manager
                    eSignal - an Interactive Data company

                    EFS KnowledgeBase
                    JavaScript for EFS Video Series
                    EFS Beginner Tutorial Series
                    EFS Glossary
                    Custom EFS Development Policy

                    New User Orientation

                    Comment


                    • #11
                      Formula overlay vs. chart Multiple Symbols

                      I am displaying a 1 minute chart containing 2 symbols, X (the main symbol) and $SPX. The index was added through the multiple symbols pop up dialogue.

                      I added symOverlay2.efs to my chart and was expecting the line plotted by the formula to match the $SPX line, but it doesn't. What can be the reason for this difference?
                      Attached Files

                      Comment


                      • #12
                        Hello probtrader,

                        This efs is not supposed to match the manually overlaid symbol by default. This difference is caused by the difference in the scaling options. The efs by default shares the same y-axis as the main chart symbol. The efs applies a multiple to the price series to force the line to be in a similar scale as the main chart symbol. The manually overlaid symbol is not sharing the same y-axis by default. Notice its price of 1202.15 displayed on the chart in between the 40.00 and 40.50 price levels from the main chart symbol’s y-axis labels.

                        To make the manual overlay and the efs line up, you need to first set both the efs and the manually overlaid symbol (via Edit Studies) to Display Left and Scale Left. Then edit the study parameters for the efs and enter 1.0 for the nFactor parameter to reset the $SPX output back to its original price level. This study is also an EFS1 study, which does not have automatic time stamp synchronization. So the other thing you need to do is to make sure you are using a time template that covers the trading session for both symbols where you don't have any zero volume bars. Hope this helps.

                        Jason K.
                        Project Manager
                        eSignal - an Interactive Data company

                        EFS KnowledgeBase
                        JavaScript for EFS Video Series
                        EFS Beginner Tutorial Series
                        EFS Glossary
                        Custom EFS Development Policy

                        New User Orientation

                        Comment


                        • #13
                          To make the manual overlay and the efs line up, you need to first set both the efs and the manually overlaid symbol (via Edit Studies) to Display Left and Scale Left. Then edit the study parameters for the efs and enter 1.0 for the nFactor parameter to reset the $SPX output back to its original price level. This study is also an EFS1 study, which does not have automatic time stamp synchronization. So the other thing you need to do is to make sure you are using a time template that covers the trading session for both symbols where you don't have any zero volume bars.
                          Jason, it looks better now but I still see a slight difference between my overlay and the EFS.

                          The options for the overlay study are Display Left, Scale Left. X and the ES #F manual overlay have No Scale, Display Right.
                          I have Auto Scale and Log Scale set on the right-click pop up menu.

                          Maybe there's another way to achieve what I'm trying to do with the EFS: I'd like to define a table of overlay mappings for each symbol I'm trading so that I won't have to retype my overlays everytime I switch stocks on the same chart. For example, I want to overlay X with NUE and ES #F plus I want to overlay NEM with $XAU and GOLD but I need want to use the same chart and switch between the two stocks all the time.
                          Attached Files

                          Comment


                          • #14
                            Hello probtrader,

                            To get the two ES lines aligned, you need to set both the efs study and the manual symbol overlay to display left and scale left. In your chart image, it looks like the manual symbol overlay is still set to no scale and display right. Double check the settings in Edit Studies.

                            To overlay multiple symbols with an EFS study, you will run into a scaling problem if you try to return multiple symbols from a single study. We don't have the ability currently to set the scaling options for each individual symbol returned to the chart by an EFS study. You would need to make multiple copies of the symoverlay study (with different names) and set each one to use its own default symbol. Then you would have to apply all of those EFS studies and set each one's display options to No Scale. This would be the only way to have all of the symbols with varying price levels viewable in the chart without creating a flat line affect.
                            Jason K.
                            Project Manager
                            eSignal - an Interactive Data company

                            EFS KnowledgeBase
                            JavaScript for EFS Video Series
                            EFS Beginner Tutorial Series
                            EFS Glossary
                            Custom EFS Development Policy

                            New User Orientation

                            Comment


                            • #15
                              Greetings.

                              With this overlay, you are able to control the line style and thickness. With manually adding multilpe chart symbols, you do not have this option. With manually adding symbols, you are able to add only four extra symbols. Is there a limit with the number of EFS overlays that can be added? Not that I would load up a chart, I was just wondering.

                              Would someone tell me how to make the StudyTitle the same color of the line? As probtrader did in his attached chart.

                              Also, could you explain how to make the displayed symbol to display left and scale left in the EFS overlay?

                              I did an overlay of $ADD line on a $INDU candlestick chart. Just trying different time frames, I found that 1minute, 3minute, 5minute, ect., displayed fine. The 2minute chart displayed a "loading data" next to the symbol title. It never did load the data.

                              Any help would be much appreciated.
                              Thanks.

                              Comment

                              Working...
                              X