When I plot this efs file 'KeltnerMCEmaBandsAdj.efs', ( I downloaded this file from forum) on emini future charts, the upper band and lower band are too far apart from the mid-band.
Can someone explain, what changes do I have to make.
bandraguy
The study you indicated is a modified version of the Keltner where the bands are calculated as a percentage of the basis line which is then added to and subtracted from the basis line.
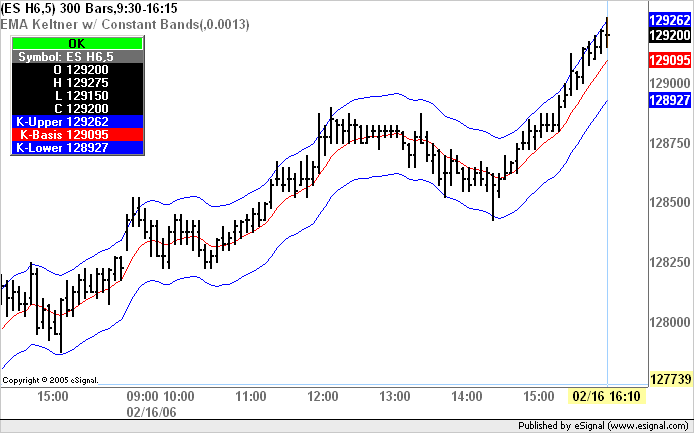
If this is the study you want then 1.3 may be simply too high a percentage for that chart and you should be using a lower value such as for example 0.0013 as shown in the enclosed image for ES (see also this thread in which Jason explains this same process to you)
If instead what you want is the traditional Keltner study then you should be using either the KeltnerAREmaAdj.efs if you want the bands based on the Average Range or KeltnerATREmaAdj.efs if you want them based on the Average True Range
Alex
 Tweet
Tweet
Comment