 Tweet
Tweet
Does anyone know what the R Multiplier for this strategy is for the emini russell (AB symbol). I dont know what R Multiplier refers to. A value of 5 is used for the ES.
-
-
Hello wpeterson,
The R multiplier is used to adjust the stop value. The author uses a default of 5 and does not give any specific values for other contracts. Lowering the R value will tighten the stop.Jason K.
Project Manager
eSignal - an Interactive Data company
EFS KnowledgeBase
JavaScript for EFS Video Series
EFS Beginner Tutorial Series
EFS Glossary
Custom EFS Development Policy
New User Orientation -
how to setup bean tick strategy?
the beantick strategy is based on the $tick. do i need to load the $tick indicator in a chart to use the beantick strategy or is it enough just to load the futures symbol (AB M6, for example) and run the efs strategy?
on tues may 9 i ran the beantick strategy on AB M6 3min chart and got a long signal. later i closed esignal and reopened the program and it is not giving a signal for the day.
is there any glitch in the strategy code that would cause this?
lastly, some of the entries for shorts have an entry "sell short for the next 15min (until 10am) at todays open (limit)"-----how is this type of instruction shown in the efs code? is there just a short arrow or something to indicate short only for next 15min ?
i have the active trader article and just want to understand what i have to look at on the esignal chart to know when there is a signal and the requirements of it.
thanks
wayneComment
-
meaning of subscripts at signal entry
i am guessing the subscripts at the signal entry correspond to the rules for entry in the active trader article.
if that is so, i can see that subscript 1 shown on may 5 fits that rule but subscript 2 on may 8 does not seem to fit rule 2 (it appears to fit rule 1 so it is a trade i think).
are the subscripts for some other purpose or is subscript 2 on may 8 an error or am i missing something entirely :-)
wayneComment
-
use close of first 15min bar not second?
i am a bit confused in the signals that is see on a 15min chart. i think the 9:45 bar on esignal ends at 10am. from reading the active trader article, i think the signal is AT 9:45. i think that means one has to use the close of the 9:30 esignal bar--which closes at 9:45
the signals showing on my esignal 15min are arrows on the 9:45 bar not the 9:30 bar.
so my question is in realtime, do the signals show up at 9:45 in realtime or later when the 9:45 bar ends at 10am? to show up realtime at 9:45 they would need to show up at the open of the 9:45 bar not the close.
thanks
wayneComment
-
Re: how to setup bean tick strategy?
Hello wayne,
No need to load the $tick chart, the formula bases its logic on the $tick data through EFS.Originally posted by wpeterson
the beantick strategy is based on the $tick. do i need to load the $tick indicator in a chart to use the beantick strategy or is it enough just to load the futures symbol (AB M6, for example) and run the efs strategy?
No, that shouldn't happen. Let me know if you see that again and post some before and after chart images if you can. I'll run this tomorrow morning and see if I can reproduce.on tues may 9 i ran the beantick strategy on AB M6 3min chart and got a long signal. later i closed esignal and reopened the program and it is not giving a signal for the day.
is there any glitch in the strategy code that would cause this?
If your chart is on a 15 min interval this logic is handled properly. There isn't anything drawn on the chart to show the limit price that would trigger the entry. Once a trade occurs an arrow will be drawn and the bars will be colored. On any interval less the 15, this logic is not set up properly. I will have to add some logic to handle lower chart intervals. For now you'll have to use a 15 min chart.lastly, some of the entries for shorts have an entry "sell short for the next 15min (until 10am) at todays open (limit)"-----how is this type of instruction shown in the efs code? is there just a short arrow or something to indicate short only for next 15min ?
The number that appears above or below the arrow indicates which condition was satisfied. Those numbers match the numbered items from the article.i have the active trader article and just want to understand what i have to look at on the esignal chart to know when there is a signal and the requirements of it.
thanks
wayneJason K.
Project Manager
eSignal - an Interactive Data company
EFS KnowledgeBase
JavaScript for EFS Video Series
EFS Beginner Tutorial Series
EFS Glossary
Custom EFS Development Policy
New User OrientationComment
-
Re: meaning of subscripts at signal entry
Hello wayne,
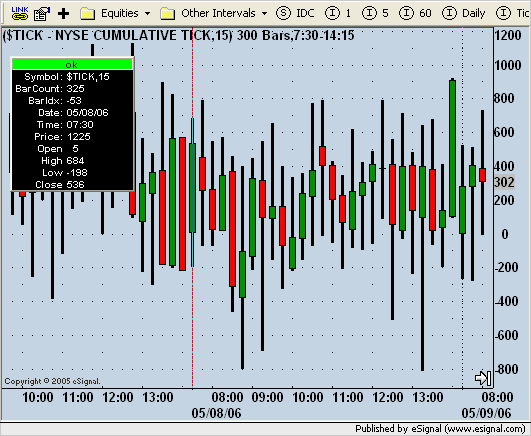
I assume we're still talking about AB M6, 3. Rule 2 is triggered if the TICK Close is > 500 and the TICK low > -350 at the end of the 930 bar on the $TICK 15 min chart, buy at market, which is the open of the following bar. The TICK close was 536 and the low was -198. You may have been looking at the $TICK 3 minute chart values, which would not have satisfied rule 2.Originally posted by wpeterson
i am guessing the subscripts at the signal entry correspond to the rules for entry in the active trader article.
if that is so, i can see that subscript 1 shown on may 5 fits that rule but subscript 2 on may 8 does not seem to fit rule 2 (it appears to fit rule 1 so it is a trade i think).
are the subscripts for some other purpose or is subscript 2 on may 8 an error or am i missing something entirely :-)
wayne
 Jason K.
Project Manager
eSignal - an Interactive Data company
EFS KnowledgeBase
JavaScript for EFS Video Series
EFS Beginner Tutorial Series
EFS Glossary
Custom EFS Development Policy
New User OrientationComment
-
Re: use close of first 15min bar not second?
Hello wayne,
The open of the 945 15 min bar is when the trade signals will be evaluated. The formula looks at the prior bars values for the conditions, which ends at 945. What may be confusing you is that TS time stamps represent the end time of a bar where as eSignal time stamps represent the start time of the bar.Originally posted by wpeterson
i am a bit confused in the signals that is see on a 15min chart. i think the 9:45 bar on esignal ends at 10am. from reading the active trader article, i think the signal is AT 9:45. i think that means one has to use the close of the 9:30 esignal bar--which closes at 9:45
They can't be drawn on the 930 bar, because we have to wait until that bar closes. 945 occurs at the open of the second 15 min bar of the session.the signals showing on my esignal 15min are arrows on the 9:45 bar not the 9:30 bar.
They will occur during 945 bar in real time. However, looking back at the code now I don't think the limit entries that could occur later during the 15 min interval will get evaluated. I will look further into this as well tomorrow morning.so my question is in realtime, do the signals show up at 9:45 in realtime or later when the 9:45 bar ends at 10am? to show up realtime at 9:45 they would need to show up at the open of the 9:45 bar not the close.
thanks
wayneJason K.
Project Manager
eSignal - an Interactive Data company
EFS KnowledgeBase
JavaScript for EFS Video Series
EFS Beginner Tutorial Series
EFS Glossary
Custom EFS Development Policy
New User OrientationComment
-
Hello wayne,
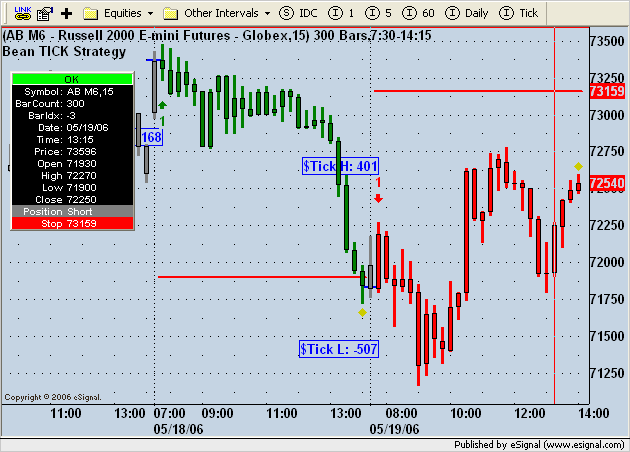
I've made the following changes to this formula.
1) Real time logic for stop and limit entries corrected. The study will now wait until that 15 minute window after the 945 to look for these entries.
2) Display enhancements to show the 930 (15 min interval) $Tick high and low as well as a blue line showing the entry price level when a trade is taken.
Please give the new version (click here to download) a try and if you see any problems, please let me know.
 Jason K.
Project Manager
eSignal - an Interactive Data company
EFS KnowledgeBase
JavaScript for EFS Video Series
EFS Beginner Tutorial Series
EFS Glossary
Custom EFS Development Policy
New User OrientationComment
-
Not getting download page.Comment
-
pbohm
It seems that the KnowledgeBase which is where that efs is stored is unavailable at this time
AlexComment
-
Thank you Alex. i will look tomorrow.Comment
-
Bean Tick Strategy error
It seems that there is still a problem with version 2 of the efs.
The tick readings are from the first bar an a $TICK 15 min chart (in a 9:30 - 16:15 time period). That bar appears to represent the opening and not the first 15 min of trading. The second bar represent the first 15 min of trading and those tick values are not used; and neither are the correct ones because that bar does not include the opening.
If I set the 15 min $TICK chart to start at 9:45 (rather than at (9:30) I get the correct readings. However the EFS uses the first bar (a 9:30 bar) contrary to the Active Trader author intentions.
Will you please clarify If I am correct or not in my interpretation of the efs generated data. Otherwise I will have to use a manual approach to an otherwise very interesting strategy.
Thank you
CarlosComment
-
Carlos
I am not sure what you mean with "That bar appears to represent the opening and not the first 15 min of trading. The second bar represent the first 15 min of trading and those tick values are not used; and neither are the correct ones because that bar does not include the opening."
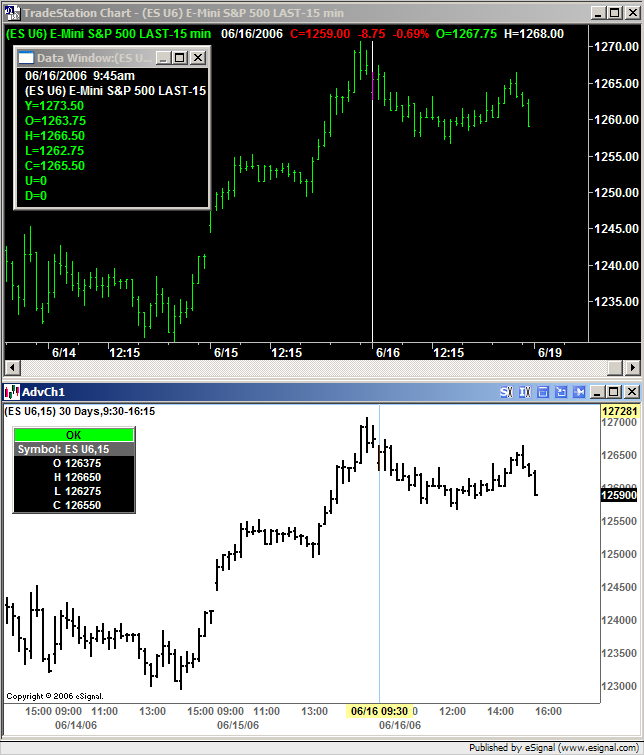
In a 15 minute chart, the first bar ie the one time stamped 9:30 represents the first 15 minutes of trading and not the one time stamped 9:45. This is because eSignal time stamps the bar with the time at the beginning of the interval whereas TradeStation (used in the examples in the article) time stamps the end of the interval.
Alex
Originally posted by cizagui
It seems that there is still a problem with version 2 of the efs.
The tick readings are from the first bar an a $TICK 15 min chart (in a 9:30 - 16:15 time period). That bar appears to represent the opening and not the first 15 min of trading. The second bar represent the first 15 min of trading and those tick values are not used; and neither are the correct ones because that bar does not include the opening.
If I set the 15 min $TICK chart to start at 9:45 (rather than at (9:30) I get the correct readings. However the EFS uses the first bar (a 9:30 bar) contrary to the Active Trader author intentions.
Will you please clarify If I am correct or not in my interpretation of the efs generated data. Otherwise I will have to use a manual approach to an otherwise very interesting strategy.
Thank you
CarlosComment
-
Carlos
Following up on my prior reply here is a screenshot showing that the bar time stamped 9:30 in eSignal is the same as the one time stamped 9:45 in TradeStation.
Alex
Comment
Comment