 Tweet
Tweet
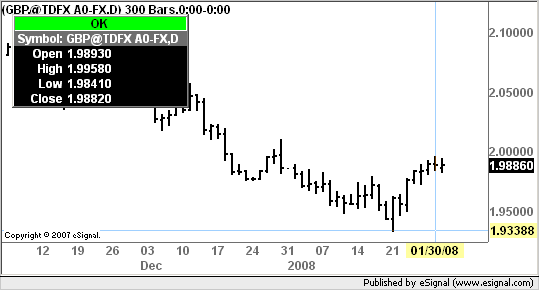
I have plotted PivotPoint.efs that is supplied with eSignal on symbol GBP@TDFX A0-FX and it is incorrectly calculating the Pivot point.
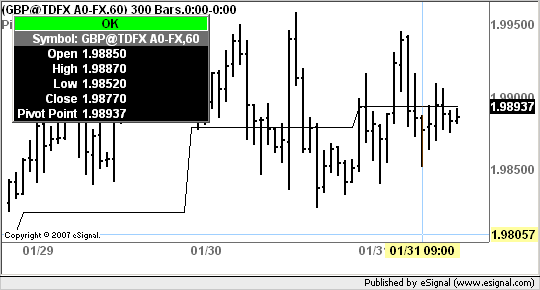
If we look at yesterday ( Jan 30th 2008) 1 hour chart the High=1.9958 Low=1.9824 Close=1.9837 so the calculation should be :
(H+L+C)/3 = 1.9873
But it is calculating and displaying the pivot as 1.9893
Can you check it out and advise whats going wrong.
thanks
Here is the PivotPoint.efs code:
/************************************************** ****************************************
Copyright © eSignal, a division of Interactive Data Corporation. 2005. All rights reserved.
This sample eSignal Formula Script (EFS) may be modified and saved under a new filename;
however, eSignal is no longer responsible for the functionality once modified.
eSignal reserves the right to modify and overwrite this EFS file with each new release.
@version 3.0 by Alexis Montenegro for eSignal
************************************************** *****************************************/
function preMain() {
setPriceStudy(true);
setStudyTitle("Pivot Point");
setCursorLabelName("Pivot Point");
// Pivot Point
setDefaultBarStyle(PS_SOLID);
setDefaultBarFgColor(Color.RGB(0,0,0));
setDefaultBarThickness(1);
}
var bInit = false;
var xHigh = null;
var xLow = null;
var xClose = null;
var vPP = null;
function main() {
if(isMonthly() || isWeekly())
return;
if(bInit == false){
xHigh = high(inv("D"));
xLow = low(inv("D"));
xClose = close(inv("D"));
bInit = true;
}
var vHigh = xHigh.getValue(-1);
var vLow = xLow.getValue(-1);
var vClose = xClose.getValue(-1);
if(vHigh == null || vLow == null || vClose == null)
return;
vPP = (vHigh+vLow+vClose)/3;
return (vPP);
}
Comment