Announcement

Collapse
No announcement yet.

Impulse CD Indicator Modify Color

Collapse
X
 
  • Filter
  • Time
  • Show
Clear All
new posts

  • Impulse CD Indicator Modify Color

    Hi There,

    I would appreciate if someone can help to modify "Impulse CD" esf by add some extra plot colour, the current one only show Green and Red like picture1. I do need extra plot colour to looks like picture 2 , it would make it easy to catch the eye ball when price start pullback. I won't used the ( Impulse Macd) and (Impulse Signal).

    Modify Impulse CD colour.
    IF Histogram above zero level colour in ( GREEN )
    IF Histogram above zero, and Bullish Retrace colour in ( WHITE )
    IF Histogram below zero level colour in( RED )
    Histogram below zero, and Bearish Retrace colour in ( WHITE )


    Picture 1 .................................................. ....... Picture 2....................
    Click image for larger version

Name:	Oscillator Green_ Red.PNG
Views:	613
Size:	14.3 KB
ID:	267403Click image for larger version

Name:	Oscillator Green Whit Red.PNG
Views:	596
Size:	16.5 KB
ID:	267402


    Description:
    Impulse CD Color

    Version: 1.0 08/26/2009

    Formula Parameters: Default:
    Slow MA 34
    Fast MA 14
    Signal MA 9

    Notes:

    **********************************/

    var fpArray
    = new Array();
    var
    bInit = false
    ;

    function
    preMain
    (){
    setPriceStudy(false
    );
    setShowCursorLabel(true
    );
    setShowTitleParameters(false
    );
    setStudyTitle("Impulse CD"
    );
    setCursorLabelName("Impulse MACD", 0
    );
    setDefaultBarFgColor(Color.blue, 0
    );
    setPlotType(PLOTTYPE_HISTOGRAM, 0
    );
    setDefaultBarThickness(2,0
    );
    setCursorLabelName("Signal", 1
    );
    setDefaultBarFgColor(Color.red, 1
    );
    setPlotType(PLOTTYPE_LINE, 1
    );
    setDefaultBarThickness(2,1
    );
    setCursorLabelName("Impulse CD", 2
    );
    setDefaultBarFgColor(Color.green, 2
    );
    setPlotType(PLOTTYPE_HISTOGRAM, 2
    );
    setDefaultBarThickness(2,2
    );
    var
    x = 0
    ;
    fpArray[x] = new FunctionParameter("SlowMA", FunctionParameter.NUMBER
    );
    with(fpArray[x
    ++]) {
    setName("Slow MA"
    );
    setLowerLimit(1
    );
    setDefault(34
    );
    }
    fpArray[x] = new FunctionParameter("FastMA", FunctionParameter.NUMBER
    );
    with(fpArray[x
    ++]) {
    setName("Fast MA"
    );
    setLowerLimit(1
    );
    setDefault(14
    );
    }
    fpArray[x] = new FunctionParameter("SignalMA", FunctionParameter.NUMBER
    );
    with(fpArray[x
    ++]) {
    setName("Signal MA"
    );
    setLowerLimit(1
    );
    setDefault(9
    );
    }
    }

    var
    xImpulseCD = null
    ;
    var
    xMACDDivr = null
    ;
    var
    xSignalMACDDivr = null
    ;
    var
    xColor = null
    ;

    function
    main(SlowMA, FastMA, SignalMA
    ) {
    var
    nBarState = getBarState
    ();
    var
    nImpulseCD = 0
    ;
    var
    nMACDDivr = 0
    ;
    var
    nSignalMACDDivr = 0
    ;
    if (
    nBarState == BARSTATE_ALLBARS
    ) {
    if(
    SlowMA == null) SlowMA = 34
    ;
    if(
    FastMA == null) FastMA = 14
    ;
    if(
    SignalMA == null) SignalMA = 9
    ;
    }
    if (
    bInit == false
    ) {
    addBand(0, PS_SOLID, 1, Color.black, "ZeroLine"
    );
    xImpulseCD = efsInternal("Calc_ImpulseCD", SlowMA, FastMA, SignalMA
    );
    xMACDDivr = getSeries(xImpulseCD, 1
    );
    xSignalMACDDivr = getSeries(xImpulseCD, 2
    );
    xColor = getSeries(xImpulseCD, 3
    );
    bInit = true
    ;
    }
    nImpulseCD = xImpulseCD.getValue(0
    );
    nMACDDivr = xMACDDivr.getValue(0
    );
    nSignalMACDDivr = xSignalMACDDivr.getValue(0
    );
    if (
    nMACDDivr == null
    ) return;
    setBarFgColor(xColor.getValue(0), 2
    );
    return new Array(
    nMACDDivr, nSignalMACDDivr, nImpulseCD
    );
    }

    var
    bSecondInit = false
    ;
    var
    xMACDDivBuff = null
    ;
    var
    xMA_MACDDivBuff = null
    ;

    function
    Calc_ImpulseCD(SlowMA, FastMA, SignalMA
    ) {
    var
    nRes = 0
    ;
    var
    cColor = Color.green
    ;
    var
    nMACDDivBuff = 0
    ;
    var
    nMA_MACDDivBuff = 0
    ;
    var
    nMACDDivBuff1 = 0
    ;
    var
    nMA_MACDDivBuff1 = 0
    ;
    if (!
    bSecondInit
    ) {
    xMACDDivBuff = macd(FastMA, SlowMA, 1
    );
    xMA_MACDDivBuff = sma(SignalMA, xMACDDivBuff
    );
    bSecondINit = true
    ;
    }
    nMACDDivBuff = xMACDDivBuff.getValue(0
    );
    nMA_MACDDivBuff = xMA_MACDDivBuff.getValue(0
    );
    nMACDDivBuff1 = xMACDDivBuff.getValue(-1
    );
    nMA_MACDDivBuff1 = xMA_MACDDivBuff.getValue(-1
    );
    if (
    nMA_MACDDivBuff1 == null
    ) return;
    nRes = nMACDDivBuff - nMA_MACDDivBuff
    ;
    if ((
    nMACDDivBuff - nMA_MACDDivBuff) > (nMACDDivBuff1 - nMA_MACDDivBuff1)) cColor = Color.green
    ;
    if ((
    nMACDDivBuff - nMA_MACDDivBuff) < (nMACDDivBuff1 - nMA_MACDDivBuff1)) cColor = Color.red
    ;
    return new Array(
    nRes, nMACDDivBuff, nMA_MACDDivBuff, cColor
    );


    Regards,

    Steven


  • #2
    Steven
    Change the following two lines in the code
    PHP Code:
    if ((nMACDDivBuff nMA_MACDDivBuff) > (nMACDDivBuff1 nMA_MACDDivBuff1)) cColor Color.green;
    if ((
    nMACDDivBuff nMA_MACDDivBuff) < (nMACDDivBuff1 nMA_MACDDivBuff1)) cColor Color.red

    to the following
    PHP Code:
    if ((nMACDDivBuff nMA_MACDDivBuff) > (nMACDDivBuff1 nMA_MACDDivBuff1)) {
        if(
    nMACDDivBuff nMA_MACDDivBuff cColor Color.green;
        else
        
    cColor Color.white;
    }
    if ((
    nMACDDivBuff nMA_MACDDivBuff) < (nMACDDivBuff1 nMA_MACDDivBuff1)) {
        if(
    nMACDDivBuff nMA_MACDDivBuff cColor Color.red;
        else
        
    cColor Color.white;


    Alex


    Originally posted by Stely View Post
    Hi There,

    I would appreciate if someone can help to modify "Impulse CD" esf by add some extra plot colour, the current one only show Green and Red like picture1. I do need extra plot colour to looks like picture 2 , it would make it easy to catch the eye ball when price start pullback. I won't used the ( Impulse Macd) and (Impulse Signal).

    Modify Impulse CD colour.
    IF Histogram above zero level colour in ( GREEN )
    IF Histogram above zero, and Bullish Retrace colour in ( WHITE )
    IF Histogram below zero level colour in( RED )
    Histogram below zero, and Bearish Retrace colour in ( WHITE )


    Picture 1 .................................................. ....... Picture 2....................
    {"data-align":"none","data-size":"custom","height":"138","width":"236","data-attachmentid":267403}{"data-align":"none","data-size":"custom","height":"136","width":"254","data-attachmentid":267402}


    Description:
    Impulse CD Color

    Version: 1.0 08/26/2009

    Formula Parameters: Default:
    Slow MA 34
    Fast MA 14
    Signal MA 9

    Notes:

    **********************************/

    var fpArray
    = new Array();
    var
    bInit = false
    ;

    function
    preMain
    (){
    setPriceStudy(false
    );
    setShowCursorLabel(true
    );
    setShowTitleParameters(false
    );
    setStudyTitle("Impulse CD"
    );
    setCursorLabelName("Impulse MACD", 0
    );
    setDefaultBarFgColor(Color.blue, 0
    );
    setPlotType(PLOTTYPE_HISTOGRAM, 0
    );
    setDefaultBarThickness(2,0
    );
    setCursorLabelName("Signal", 1
    );
    setDefaultBarFgColor(Color.red, 1
    );
    setPlotType(PLOTTYPE_LINE, 1
    );
    setDefaultBarThickness(2,1
    );
    setCursorLabelName("Impulse CD", 2
    );
    setDefaultBarFgColor(Color.green, 2
    );
    setPlotType(PLOTTYPE_HISTOGRAM, 2
    );
    setDefaultBarThickness(2,2
    );
    var
    x = 0
    ;
    fpArray[x] = new FunctionParameter("SlowMA", FunctionParameter.NUMBER
    );
    with(fpArray[x
    ++]) {
    setName("Slow MA"
    );
    setLowerLimit(1
    );
    setDefault(34
    );
    }

    fpArray[x] = new FunctionParameter("FastMA", FunctionParameter.NUMBER
    );
    with(fpArray[x
    ++]) {
    setName("Fast MA"
    );
    setLowerLimit(1
    );
    setDefault(14
    );
    }

    fpArray[x] = new FunctionParameter("SignalMA", FunctionParameter.NUMBER
    );
    with(fpArray[x
    ++]) {
    setName("Signal MA"
    );
    setLowerLimit(1
    );
    setDefault(9
    );
    }
    }

    var
    xImpulseCD = null
    ;
    var
    xMACDDivr = null
    ;
    var
    xSignalMACDDivr = null
    ;
    var
    xColor = null
    ;

    function
    main(SlowMA, FastMA, SignalMA
    ) {
    var
    nBarState = getBarState
    ();
    var
    nImpulseCD = 0
    ;
    var
    nMACDDivr = 0
    ;
    var
    nSignalMACDDivr = 0
    ;
    if (
    nBarState == BARSTATE_ALLBARS
    ) {
    if(
    SlowMA == null) SlowMA = 34
    ;
    if(
    FastMA == null) FastMA = 14
    ;
    if(
    SignalMA == null) SignalMA = 9
    ;
    }
    if (
    bInit == false
    ) {
    addBand(0, PS_SOLID, 1, Color.black, "ZeroLine"
    );
    xImpulseCD = efsInternal("Calc_ImpulseCD", SlowMA, FastMA, SignalMA
    );
    xMACDDivr = getSeries(xImpulseCD, 1
    );
    xSignalMACDDivr = getSeries(xImpulseCD, 2
    );
    xColor = getSeries(xImpulseCD, 3
    );
    bInit = true
    ;
    }

    nImpulseCD = xImpulseCD.getValue(0
    );
    nMACDDivr = xMACDDivr.getValue(0
    );
    nSignalMACDDivr = xSignalMACDDivr.getValue(0
    );
    if (
    nMACDDivr == null
    ) return;
    setBarFgColor(xColor.getValue(0), 2
    );
    return new Array(
    nMACDDivr, nSignalMACDDivr, nImpulseCD
    );
    }

    var
    bSecondInit = false
    ;
    var
    xMACDDivBuff = null
    ;
    var
    xMA_MACDDivBuff = null
    ;

    function
    Calc_ImpulseCD(SlowMA, FastMA, SignalMA
    ) {
    var
    nRes = 0
    ;
    var
    cColor = Color.green
    ;
    var
    nMACDDivBuff = 0
    ;
    var
    nMA_MACDDivBuff = 0
    ;
    var
    nMACDDivBuff1 = 0
    ;
    var
    nMA_MACDDivBuff1 = 0
    ;
    if (!
    bSecondInit
    ) {
    xMACDDivBuff = macd(FastMA, SlowMA, 1
    );
    xMA_MACDDivBuff = sma(SignalMA, xMACDDivBuff
    );
    bSecondINit = true
    ;
    }

    nMACDDivBuff = xMACDDivBuff.getValue(0
    );
    nMA_MACDDivBuff = xMA_MACDDivBuff.getValue(0
    );
    nMACDDivBuff1 = xMACDDivBuff.getValue(-1
    );
    nMA_MACDDivBuff1 = xMA_MACDDivBuff.getValue(-1
    );
    if (
    nMA_MACDDivBuff1 == null
    ) return;
    nRes = nMACDDivBuff - nMA_MACDDivBuff
    ;
    if ((
    nMACDDivBuff - nMA_MACDDivBuff) > (nMACDDivBuff1 - nMA_MACDDivBuff1)) cColor = Color.green
    ;
    if ((
    nMACDDivBuff - nMA_MACDDivBuff) < (nMACDDivBuff1 - nMA_MACDDivBuff1)) cColor = Color.red
    ;
    return new Array(
    nRes, nMACDDivBuff, nMA_MACDDivBuff, cColor
    );


    Regards,

    Steven

    Comment


    • #3
      Steven
      FWIW the code you posted also plots the Impulse MACD and Signal however the image you enclosed only shows the Impulse CD so it is not clear if you already made the required changes to the main() function.
      If not and you only want to plot the Impulse CD then you also need to modify the following two lines of code
      PHP Code:
      setBarFgColor(xColor.getValue(0), 2);
      return new Array(
      nMACDDivrnSignalMACDDivrnImpulseCD); 

      to the following
      PHP Code:
      setBarFgColor(xColor.getValue(0), 0);
      return 
      nImpulseCD

      Alex

      Comment


      • #4
        Hi Alex,
        I appreciated you modified the code, Indicator is looking great now.

        I want to develop the eSignal dashboard for intraday Forex, which combine 2 different time frame, and multi indictors as well.

        Please let's me know if are you interested.

        Thanks again.
        Regards
        Steven

        Comment


        • #5
          Steven
          Thank you for asking but I am not interested. While I am occasionally available to help out in the forum I do not provide any custom programming.
          Alex


          Originally posted by Stely View Post
          Hi Alex,
          I appreciated you modified the code, Indicator is looking great now.

          I want to develop the eSignal dashboard for intraday Forex, which combine 2 different time frame, and multi indictors as well.

          Please let's me know if are you interested.

          Thanks again.
          Regards
          Steven

          Comment


          • #6
            Hi Alex,
            No a problem, can I ask you other favour, I tried to modify Awesome Oscillator same as Impulse CD , I've followed your code and made the changes, but not successful somehow it showed one colour only,


            Bill Williams. Awesome Oscillator (AO)
            Formula Parameters: Default:
            nLengthSlow 34
            nLengthFast 5

            var fpArray = new Array();
            var bInit = false;

            function preMain() {
            setStudyTitle("Awesome Oscillator");
            setCursorLabelName("ABillW AO", 0);
            setDefaultBarThickness(1,0);
            setPlotType(PLOTTYPE_HISTOGRAM);
            var x=0;
            fpArray[x] = new FunctionParameter("nLengthSlow", FunctionParameter.NUMBER);
            with(fpArray[x++]){
            setLowerLimit(1);
            setDefault(35);
            }
            fpArray[x] = new FunctionParameter("nLengthFast", FunctionParameter.NUMBER);
            with(fpArray[x++]){
            setLowerLimit(1);
            setDefault(5);
            }
            }

            var xCalc_hl2 = null;

            function main(nLengthFast, nLengthSlow) {
            var nBarState = getBarState();
            var nAO = 0;
            var nAO1 = 0;

            if (nBarState == BARSTATE_ALLBARS) {
            if (nLengthSlow == null) nLengthSlow = 34;
            if (nLengthFast == null) nLengthFast = 5;
            }

            if (bInit == false) {
            xCalc_hl2 = efsInternal("CalcSMA1_SMA2", nLengthFast, nLengthSlow);
            bInit = true;
            }

            nAO = xCalc_hl2.getValue(0);
            nAO1 = xCalc_hl2.getValue(-1);
            if (nAO1 == null) return;
            if (nAO &gt; nAO1) setBarFgColor(Color.RGB(0,150,0 ));
            else setBarFgColor(Color.red);
            return nAO;
            }


            var bSecondInit = false;
            var xSMA1_hl2 = null;
            var xSMA2_hl2 = null;

            function CalcSMA1_SMA2(nLengthFast, nLengthSlow) {
            var nRes = 0;
            var SMA1 = 0;
            var SMA2 = 0;
            if (bSecondInit == false) {
            xSMA1_hl2 = sma(nLengthFast, hl2());
            xSMA2_hl2 = sma(nLengthSlow, hl2());
            bSecondInit = true;
            }
            SMA1 = xSMA1_hl2.getValue(0);
            SMA2 = xSMA2_hl2.getValue(0);
            if (SMA1 == null || SMA2 == null) return;
            nRes = SMA1 - SMA2;
            return nRes;
            }


            I have made some changes, but did not successful , only showed one colour.

            if (nAO &gt; nAO1) {
            if(nAO &gt; 0 )cColor = Color.RGB(0,155,0 ) ;
            else
            cColor = Color.RGB( 220,220,220 );
            }
            if (nAO &lt; nAO1) {
            if(nAO &lt; 0 ) cColor = (Color.red);
            else
            cColor = Color.RGB( 220,220,220 );
            }
            return nAO ;
            }

            Click image for larger version

Name:	Capture.PNG
Views:	1571
Size:	1.9 KB
ID:	267409

            Regards
            Steven
            Last edited by Stely; 11-07-2016, 04:56 PM.

            Comment


            • #7
              Steven
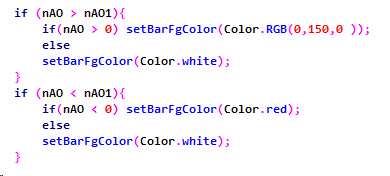
              The logic is exactly the same. Replace the following two lines


              with the following


              For future reference when you are posting code please use the php tags [see the vBulletin Help if you are unfamiliar with how to use them] so that the code maintains its formatting thereby making it easier for those who are trying to assist you.
              Also if you are unfamiliar with programming in EFS then I would suggest that you review the JavaScript for EFS video series and the Core JavaScript Reference Guide. Those will provide you with a thorough introduction to programming in JavaScript which is at the foundation of EFS. Then go through the EFS KnowledgeBase and study the Help Guides and Tutorials which will provide you with the specifics of EFS.
              Alex


              Originally posted by Stely View Post
              Hi Alex,
              No a problem, can I ask you other favour, I tried to modify Awesome Oscillator same as Impulse CD , I've followed your code and made the changes, but not successful somehow it showed one colour only,


              Bill Williams. Awesome Oscillator (AO)
              Formula Parameters: Default:
              nLengthSlow 34
              nLengthFast 5

              var fpArray = new Array();
              var bInit = false;

              function preMain() {
              setStudyTitle("Awesome Oscillator");
              setCursorLabelName("ABillW AO", 0);
              setDefaultBarThickness(1,0);
              setPlotType(PLOTTYPE_HISTOGRAM);
              var x=0;
              fpArray[x] = new FunctionParameter("nLengthSlow", FunctionParameter.NUMBER);
              with(fpArray[x++]){
              setLowerLimit(1);
              setDefault(35);
              }
              fpArray[x] = new FunctionParameter("nLengthFast", FunctionParameter.NUMBER);
              with(fpArray[x++]){
              setLowerLimit(1);
              setDefault(5);
              }
              }

              var xCalc_hl2 = null;

              function main(nLengthFast, nLengthSlow) {
              var nBarState = getBarState();
              var nAO = 0;
              var nAO1 = 0;

              if (nBarState == BARSTATE_ALLBARS) {
              if (nLengthSlow == null) nLengthSlow = 34;
              if (nLengthFast == null) nLengthFast = 5;
              }

              if (bInit == false) {
              xCalc_hl2 = efsInternal("CalcSMA1_SMA2", nLengthFast, nLengthSlow);
              bInit = true;
              }

              nAO = xCalc_hl2.getValue(0);
              nAO1 = xCalc_hl2.getValue(-1);
              if (nAO1 == null) return;
              if (nAO &gt; nAO1) setBarFgColor(Color.RGB(0,150,0 ));
              else setBarFgColor(Color.red);
              return nAO;
              }


              var bSecondInit = false;
              var xSMA1_hl2 = null;
              var xSMA2_hl2 = null;

              function CalcSMA1_SMA2(nLengthFast, nLengthSlow) {
              var nRes = 0;
              var SMA1 = 0;
              var SMA2 = 0;
              if (bSecondInit == false) {
              xSMA1_hl2 = sma(nLengthFast, hl2());
              xSMA2_hl2 = sma(nLengthSlow, hl2());
              bSecondInit = true;
              }
              SMA1 = xSMA1_hl2.getValue(0);
              SMA2 = xSMA2_hl2.getValue(0);
              if (SMA1 == null || SMA2 == null) return;
              nRes = SMA1 - SMA2;
              return nRes;
              }


              I have made some changes, but did not successful , only showed one colour.

              if (nAO &gt; nAO1) {
              if(nAO &gt; 0 )cColor = Color.RGB(0,155,0 ) ;
              else
              cColor = Color.RGB( 220,220,220 );
              }
              if (nAO &lt; nAO1) {
              if(nAO &lt; 0 ) cColor = (Color.red);
              else
              cColor = Color.RGB( 220,220,220 );
              }
              return nAO ;
              }

              {"data-align":"none","data-size":"small","data-attachmentid":267409}

              Regards
              Steven

              Comment


              • #8
                Hi Alex,
                The Indicator looks great.
                Thanks again.
                Regards
                Steven

                Comment


                • #9
                  Steven
                  You are welcome
                  Alex


                  Originally posted by Stely View Post
                  Hi Alex,
                  The Indicator looks great.
                  Thanks again.
                  Regards
                  Steven

                  Comment

                  Working...
                  X