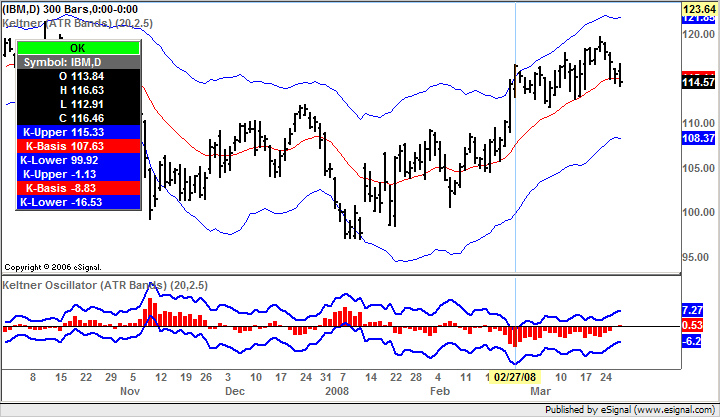
keltnerOscAtrEmaAdj.efs.This study plots longs as short and vice versa.I don't know how to correct this. This study is in EFS Database and was posted by W Myers in 2003.
Announcement
Collapse
No announcement yet.
keltner osc
Collapse
X
-
traderob
As far as I can see the study is calculating and plotting correctly.
The Keltner Oscillator indicates where [and by how much] the Keltner Basis line is respect to the Close. In a rising market when the Keltner Basis line is below the Close the Oscillator will return negative values and the opposite in a falling market (when the Keltner Basis line is above the Close)
In the price pane of the chart screenshot enclosed below you can see that the Keltner Basis line is at 107.63 and the Close is at 116.46. This means that the Keltner Basis line is below the Close by -8.83 which is in fact the value returned by the Keltner Oscillator
If you prefer a different [but not necessarily more or less correct] representation of the study where it calculates the difference between the Close and the Keltner Basis line then just reverse the equations in lines 67 through 69
Alex

Originally posted by traderob
I am not asking for a new study. This study already exits in EFS Database/Keltner/Keltner Osc Atr Emadl.efs. The study has a problem in the code because it does not plot correctly.
Comment
Comment