 Tweet
Tweet
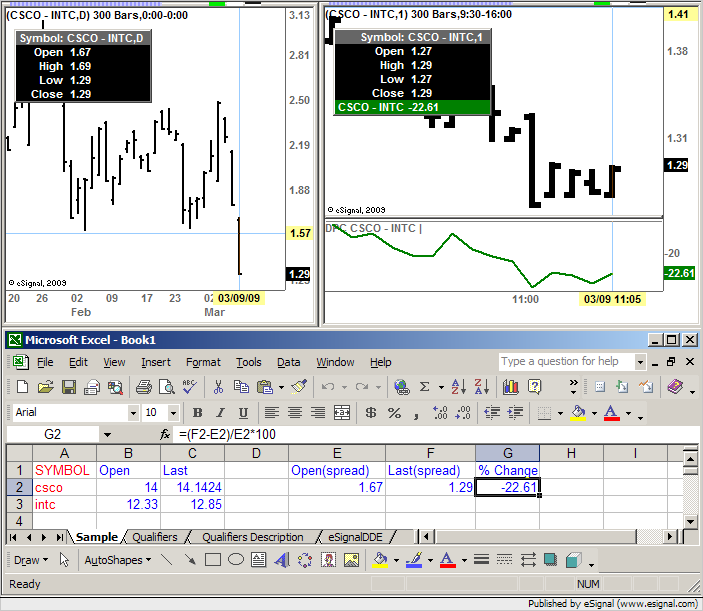
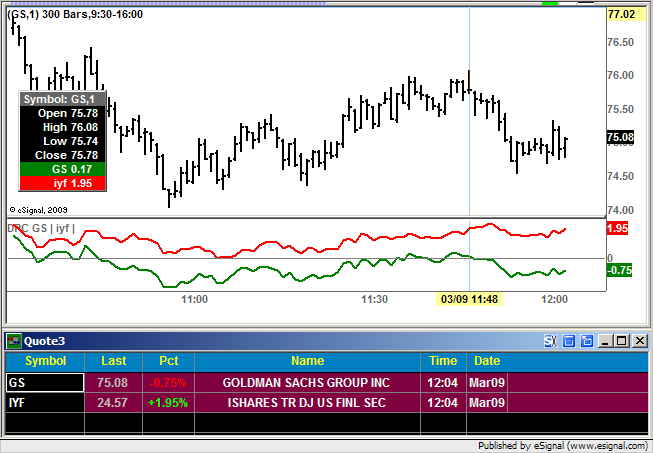
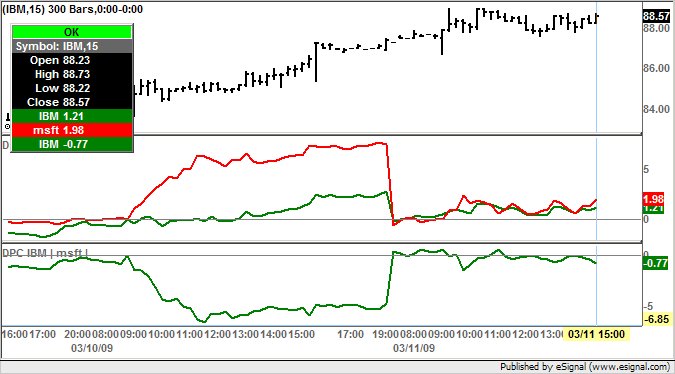
I am trying to compare the intraday percentage change between pairs of stocks. As far as I can tell this is not possible using the advanced charting functions but is possible with the .efs file "DailyPercentComp".
For some reason however, the % change readouts I am getting from the DailyPercentCompdo not seem to be accurate....the figures are completely different that the percentage change for any particular day and if they are based on the first bar in the series of days shown in the selected time period, then this figure isnt correct either!? I have also tried using "SymOverlay2" and that doesn't seem to be accurate as well...
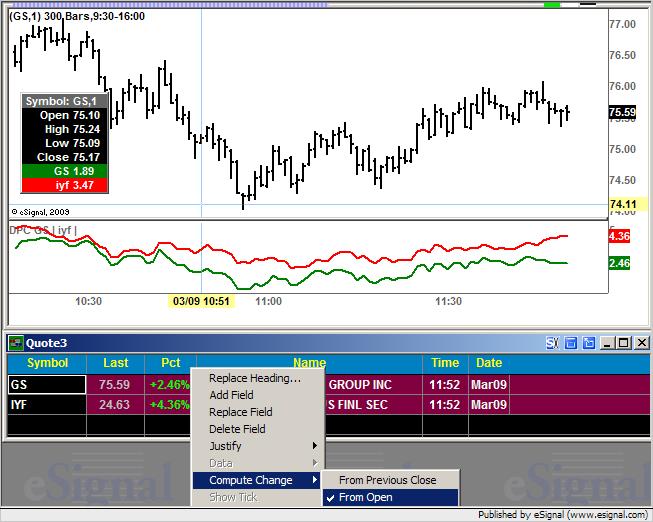
What am I missing with these efs files? are there others that do a better job of showing % change spreads between pairs? Is there a way to show on the upper chart level the % change spread at all? As far as I can tell this isnt possible at all in esignal and I am very surprised this is the case in addition to being disappointed since this is the only reason I purchased the software int he first place.
For some reason however, the % change readouts I am getting from the DailyPercentCompdo not seem to be accurate....the figures are completely different that the percentage change for any particular day and if they are based on the first bar in the series of days shown in the selected time period, then this figure isnt correct either!? I have also tried using "SymOverlay2" and that doesn't seem to be accurate as well...
What am I missing with these efs files? are there others that do a better job of showing % change spreads between pairs? Is there a way to show on the upper chart level the % change spread at all? As far as I can tell this isnt possible at all in esignal and I am very surprised this is the case in addition to being disappointed since this is the only reason I purchased the software int he first place.
Comment