Hello Matt,
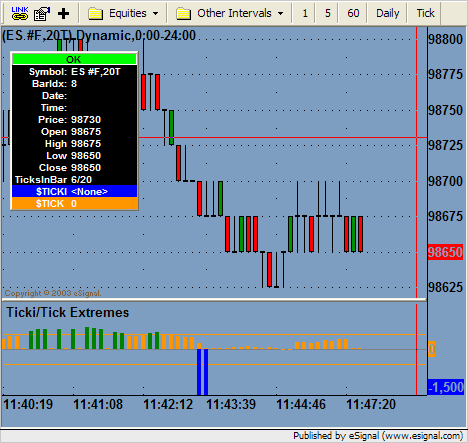
I've identified the problem and below is an updated formula that should work for you. The problem is related to how calls to high(0, 1, "$tick") works. Because our chart is using an 800T interval, high() returns the high for $tick over the last 800 ticks for $tick, not the chart's symbol. As we've seen in my previous message, 800 ticks of $tick covers a much greater period of time that 800 ticks of ES. The fix here corrects the problem by building the HLC information as ticks come in. Therefore, on tick or raw tick charts, this formula will not be able to display the historical information. The formula will work as normal on intraday intervals.
TickExtremes.efs


Comment