Announcement

Collapse
No announcement yet.

Cumulative Relative Performance does not plot

Collapse
X
 
  • Filter
  • Time
  • Show
Clear All
new posts

  • Cumulative Relative Performance does not plot

    I've utilised the RelativeStrengthRatio.efs on the Library to create a Relative Performance indicator. I've made the following changes to the code:

    function main(Symbol1) {
    if (vLoaded == false) {
    cSym = getSymbol();
    if (Symbol1 == null) {
    vSym = "$STI-SES";
    vEdit = false
    } else {
    vSym = Symbol1;
    vEdit = true;
    }
    vLoaded = true;
    preMain();
    }

    if (vSym != null) {
    var StockChg = (close(0)/close(-1)-1)*100;
    var CurrIndex = close(0, 1, vSym);
    var PrevIndex = close(-1, 1, vSym);
    var IndexChg = (CurrIndex/PrevIndex-1)*100;
    var RelPerf = StockChg-IndexChg;
    return RelPerf;
    } else {
    return;
    }
    }

    The above works as I expect. However, what I want to do is to create a Cumulative Relative Performance which adds each period's Rel Performance. The code below which I wrote does not plot however:

    if (vSym != null) {
    var StockChg = (close(0)/close(-1)-1)*100;
    var CurrIndex = close(0, 1, vSym);
    var PrevIndex = close(-1, 1, vSym);
    var IndexChg = (CurrIndex/PrevIndex-1)*100;
    var RelPerf = StockChg-IndexChg;
    if (getCurrentBarCount() > 1) {
    var CumRelPerf = CumRelPerf(-1) + RelPerf(0);
    } else {
    CumRelPerf = 0;
    }
    return CumRelPerf;
    } else {
    return;
    }

    I think the problem has to do with setting the Relative Performance of initial Bar 1 as 0, and the code I use above may be incorrect.

    Would appreciate help/suggestions from anyone. Thanks.
  • #2
    Re: Cumulative Relative Performance does not plot

    Dr Kildare
    The reason it is not working is that the variable CumRelPerf is not a series but a value so you cannot call its prior values using the CumRelPerf(-1) notation.
    You need to first retrieve the value at the prior bar assigning it to a new variable and then use that variable in the accumulation routine.
    Assuming that the item you want to accumulate is being returned by the script then the easiest way to do this is to use the ref() function [see the link to the corresponding article in the EFS KnowledgeBase]
    You can find a recent example of the use of the ref() function in the context of an accumulation routine in this thread
    In your case you will need to do something like in the following example
    PHP Code:
    if (getCurrentBarCount() > 1) {
        var 
    CumRelPerf_1 ref(-1);
        var 
    CumRelPerf CumRelPerf_1 RelPerf;
        
    //rest of your code 
    See if that corrects the issue
    Alex


    Originally posted by Dr Kildare
    I've utilised the RelativeStrengthRatio.efs on the Library to create a Relative Performance indicator. I've made the following changes to the code:

    function main(Symbol1) {
    if (vLoaded == false) {
    cSym = getSymbol();
    if (Symbol1 == null) {
    vSym = "$STI-SES";
    vEdit = false
    } else {
    vSym = Symbol1;
    vEdit = true;
    }
    vLoaded = true;
    preMain();
    }

    if (vSym != null) {
    var StockChg = (close(0)/close(-1)-1)*100;
    var CurrIndex = close(0, 1, vSym);
    var PrevIndex = close(-1, 1, vSym);
    var IndexChg = (CurrIndex/PrevIndex-1)*100;
    var RelPerf = StockChg-IndexChg;
    return RelPerf;
    } else {
    return;
    }
    }

    The above works as I expect. However, what I want to do is to create a Cumulative Relative Performance which adds each period's Rel Performance. The code below which I wrote does not plot however:

    if (vSym != null) {
    var StockChg = (close(0)/close(-1)-1)*100;
    var CurrIndex = close(0, 1, vSym);
    var PrevIndex = close(-1, 1, vSym);
    var IndexChg = (CurrIndex/PrevIndex-1)*100;
    var RelPerf = StockChg-IndexChg;
    if (getCurrentBarCount() > 1) {
    var CumRelPerf = CumRelPerf(-1) + RelPerf(0);
    } else {
    CumRelPerf = 0;
    }
    return CumRelPerf;
    } else {
    return;
    }

    I think the problem has to do with setting the Relative Performance of initial Bar 1 as 0, and the code I use above may be incorrect.

    Would appreciate help/suggestions from anyone. Thanks.

    Comment


    • #3
      Hi Alex -- that worked!

      Looking thru the plot data, what I find is that the summation of gains and losses does not yield the result I want, which is % performance vs the Index, and w.r.t a specific date. This way, I don't need to accumulate the RelPerf.

      Is there a way to get the closing price of a specific bar? e.g. close for week of Dec 25 2006, or a specific day? The relative performance would then be computed vs this reference or base date. An this base date would plot as zero on the indicator.

      Thanks for your help, and appreciate the additional help you can offer.

      regards.

      Comment


      • #4
        Dr Kildare

        Is there a way to get the closing price of a specific bar? e.g. close for week of Dec 25 2006, or a specific day?
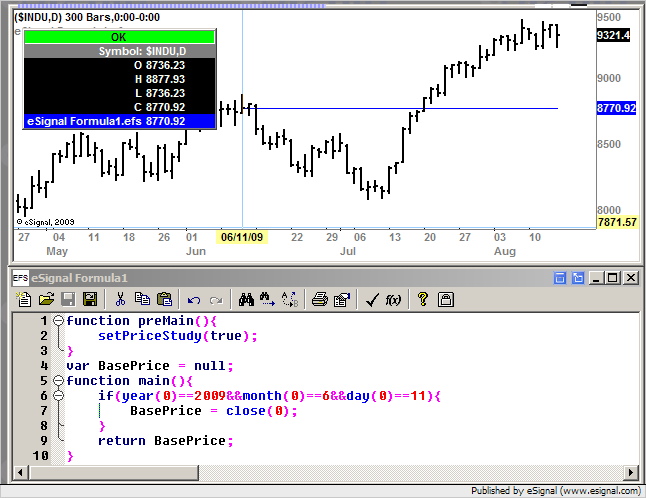
        You can retrieve the price of a specific date by setting up a condition that checks for that date and stores the value in a global variable (see the example in the screenshot enclosed below). You can then use this value as the base for your calculations
        Alex


        Originally posted by Dr Kildare
        Hi Alex -- that worked!

        Looking thru the plot data, what I find is that the summation of gains and losses does not yield the result I want, which is % performance vs the Index, and w.r.t a specific date. This way, I don't need to accumulate the RelPerf.

        Is there a way to get the closing price of a specific bar? e.g. close for week of Dec 25 2006, or a specific day? The relative performance would then be computed vs this reference or base date. An this base date would plot as zero on the indicator.

        Thanks for your help, and appreciate the additional help you can offer.

        regards.

        Comment


        • #5
          Hi Alex -- using your suggestion, I created a new function (GetBasePrice) to get the base price for the stock and the index for a specific date, and placed it before the preMain and Main functions as recommended. I also created BasePriceStock and BasePriceIndex as global variables.

          Unfortunately, it does not plot. The syntax is OK. Any ideas what the problem is? I attach the complete efs below for your review.

          Thx again for your ongoing help ...

          var vLoaded = false;
          var vEdit = false;
          var cSym = "";
          var vSym = "$STI-SES";
          var BasePriceStock=null;
          var BasePriceIndex=null;

          function (GetBasePrice) {
          if (year(0)==2008&&month(0)==12&&day(0)==31) {
          BasePriceStock = close(0);
          BasePriceIndex = close(0, vSym);
          }
          return BasePriceStock;
          return BasePrieIndex;
          }
          function preMain() {
          if (vLoaded == false) {
          setDefaultBarFgColor(Color.yellow);
          } else {
          if (vEdit == false) {
          setStudyTitle(cSym + " vs. " + vSym + " ");
          setCursorLabelName(cSym + "\/" + vSym);
          } else {
          setStudyTitle(cSym + " vs. ");
          setCursorLabelName(cSym + "\/" + vSym);
          }
          }
          }

          function main(Symbol1) {
          if (vLoaded == false) {
          cSym = getSymbol();
          if (Symbol1 == null) {
          vSym = "$STI-SES";
          vEdit = false
          } else {
          vSym = Symbol1;
          vEdit = true;
          }
          vLoaded = true;
          preMain();
          }
          if (vSym != null) {
          var StockChg = (close(0)/BasePriceStock-1)*100;
          var CurrIndex = close(0, 1, vSym);
          var IndexChg = (CurrIndex/BasePriceIndex-1)*100;
          var RelPerf = StockChg-IndexChg;
          return RelPerf;
          } else {
          return;
          }
          }

          Comment


          • #6
            Dr Kildare
            Aside from some syntax errors such as
            function (GetBasePrice) { which should be function GetBasePrice(arguments_if_any) {
            and a double return statement ie
            return BasePriceStock;
            return BasePrieIndex;

            which means that the function will return only the item in the first statement and discard the following one [you need to return an Array if you have more than one item] and the fact that you are not calling that function from your main [or any other] function I think you are making this unnecessarily complicated
            Just follow the example I provided and calculate those values in the main function and it should work
            Alex


            Originally posted by Dr Kildare
            Hi Alex -- using your suggestion, I created a new function (GetBasePrice) to get the base price for the stock and the index for a specific date, and placed it before the preMain and Main functions as recommended. I also created BasePriceStock and BasePriceIndex as global variables.

            Unfortunately, it does not plot. The syntax is OK. Any ideas what the problem is? I attach the complete efs below for your review.

            Thx again for your ongoing help ...

            var vLoaded = false;
            var vEdit = false;
            var cSym = "";
            var vSym = "$STI-SES";
            var BasePriceStock=null;
            var BasePriceIndex=null;

            function (GetBasePrice) {
            if (year(0)==2008&&month(0)==12&&day(0)==31) {
            BasePriceStock = close(0);
            BasePriceIndex = close(0, vSym);
            }
            return BasePriceStock;
            return BasePrieIndex;
            }
            function preMain() {
            if (vLoaded == false) {
            setDefaultBarFgColor(Color.yellow);
            } else {
            if (vEdit == false) {
            setStudyTitle(cSym + " vs. " + vSym + " ");
            setCursorLabelName(cSym + "\/" + vSym);
            } else {
            setStudyTitle(cSym + " vs. ");
            setCursorLabelName(cSym + "\/" + vSym);
            }
            }
            }

            function main(Symbol1) {
            if (vLoaded == false) {
            cSym = getSymbol();
            if (Symbol1 == null) {
            vSym = "$STI-SES";
            vEdit = false
            } else {
            vSym = Symbol1;
            vEdit = true;
            }
            vLoaded = true;
            preMain();
            }
            if (vSym != null) {
            var StockChg = (close(0)/BasePriceStock-1)*100;
            var CurrIndex = close(0, 1, vSym);
            var IndexChg = (CurrIndex/BasePriceIndex-1)*100;
            var RelPerf = StockChg-IndexChg;
            return RelPerf;
            } else {
            return;
            }
            }

            Comment

            Working...
            X