 Tweet
Tweet
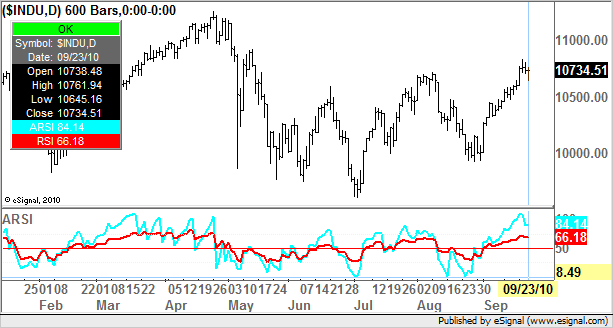
One of my favorite indicators is the ARSI -- the Asymmetrical RSI that Sylvain Vervoort wrote about in the October 2008 issue of Stocks & Commodities Magazine and that eSignal made available in an EFS script, which I've attached.
I find it useful on all time frames. However, on the daily chart, whenever the markets are closed, it returns an error, and I haven't been able to figure out why.
Can anyone tell me what the problem is? I don't know if the readings it gives on the daily chart are valid.
Steven Miller
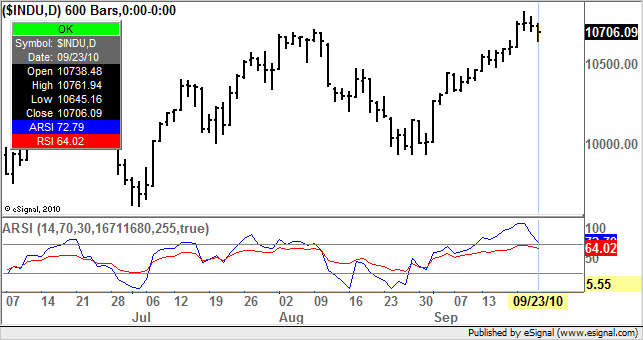
I find it useful on all time frames. However, on the daily chart, whenever the markets are closed, it returns an error, and I haven't been able to figure out why.
Can anyone tell me what the problem is? I don't know if the readings it gives on the daily chart are valid.
Steven Miller
Comment