Hello,
My name is Abiodun. I am an active trader and i use esignal for charting daily.
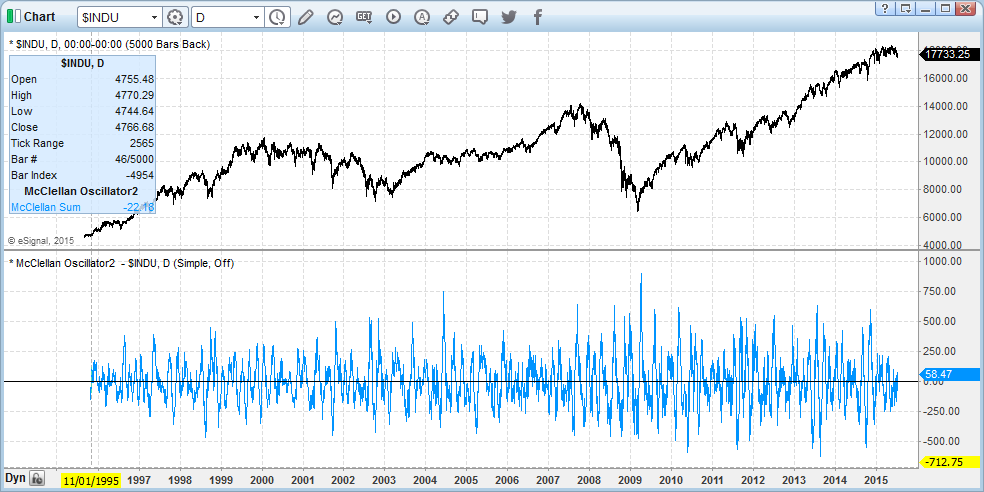
I have recently had a request for the McClellan Oscillator EFS studies sent so that i can check market breadth.
I had the formular sent to me today with the title " McClellanOsc2.efs". i have added this to my formular directory and its in my chart right now. The problem with this is that there seems to be some restrictions on the code as it only shows historical readings for maximum of one year. Any timeframe beyond one year (corresponding to daily price bar chart) appears as a flat line. I have spoken to esignal and they have adviced that I bring this to the forum maybe somebody can look into the code and remove the restrictions.
I have attached the file.
I would be happy if anyone can help
Regards
abbeytole.

Comment