 Tweet
Tweet
Hi all, i changed a pivot point EFS to plot me the 1/4's of the yesterday daily bar range above the High/Low of the day. but i need to know if there is possible to do the folowing.
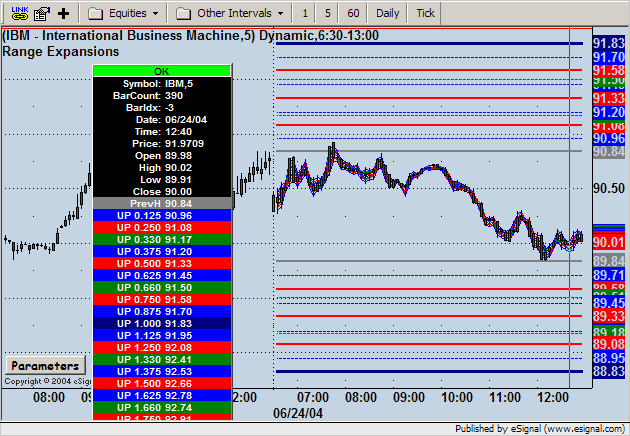
1. plot only today extentions, that is, erase all lines in the past of the chart except today extentions.
2. being able to show/hide the extentions using some buttom in the chart, like some i saw in a murray math script.
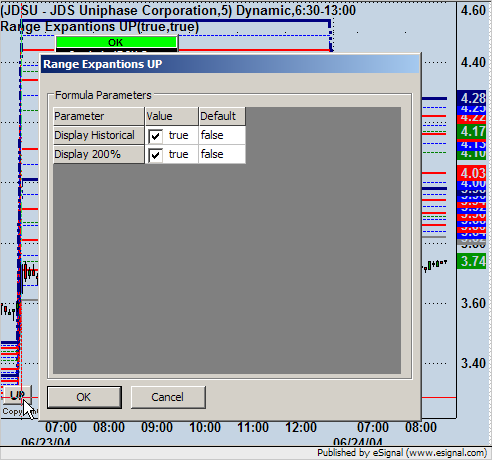
3. if possible, this is just a luxuriouse issue, a way to show the extentions until 100% and only if buttom clicked show the full extentions until 200%.
I have two scrips, one for up extentions and another to down extentions, if button works with hide/show, it is possible to merge both efs and do a up/down buttoms?
Will apreciate all help.
Best Regards
Gil Araújo
Below the code
function preMain() {
setPriceStudy(true);
setStudyTitle("Range Expantions DONW");
setCursorLabelName("0.125", 0);
setCursorLabelName("0.250", 1);
setCursorLabelName("0.330", 2);
setCursorLabelName("0.375", 3);
setCursorLabelName("0.500", 4);
setCursorLabelName("0.625", 5);
setCursorLabelName("0.660", 6);
setCursorLabelName("0.750", 7);
setCursorLabelName("0.875", 8);
setCursorLabelName("1.000", 9);
setCursorLabelName("1.125", 10);
setCursorLabelName("1.250", 11);
setCursorLabelName("1.330", 12);
setCursorLabelName("1.375", 13);
setCursorLabelName("1.500", 14);
setCursorLabelName("1.625", 15);
setCursorLabelName("1.660", 16);
setCursorLabelName("1.750", 17);
setCursorLabelName("1.875", 18);
setCursorLabelName("2.000", 19);
setCursorLabelName("PrevL", 20);
//setComputeOnClose(true);
setDefaultBarStyle(PS_SOLID, 0);
setDefaultBarFgColor(Color.RGB(30,144,255), 0);
setDefaultBarThickness(1, 0);
setDefaultBarStyle(PS_SOLID, 0);
setDefaultBarFgColor(Color.RGB(30,144,255), 0);
setDefaultBarThickness(1, 1);
setDefaultBarStyle(PS_SOLID, 0);
setDefaultBarFgColor(Color.RGB(30,144,255), 0);
setDefaultBarThickness(1, 2);
setDefaultBarStyle(PS_SOLID, 0);
setDefaultBarFgColor(Color.RGB(30,144,255), 0);
setDefaultBarThickness(1, 3);
setDefaultBarStyle(PS_SOLID, 0);
setDefaultBarFgColor(Color.RGB(30,144,255), 0);
setDefaultBarThickness(1, 4);
setDefaultBarStyle(PS_SOLID, 0);
setDefaultBarFgColor(Color.RGB(30,144,255), 0);
setDefaultBarThickness(1, 5);
setDefaultBarStyle(PS_SOLID, 0);
setDefaultBarFgColor(Color.RGB(30,144,255), 0);
setDefaultBarThickness(1, 6);
setDefaultBarStyle(PS_SOLID, 0);
setDefaultBarFgColor(Color.RGB(30,144,255), 0);
setDefaultBarThickness(1, 7);
setDefaultBarStyle(PS_SOLID, 0);
setDefaultBarFgColor(Color.RGB(30,144,255), 0);
setDefaultBarThickness(1, 8);
setDefaultBarStyle(PS_SOLID, 0);
setDefaultBarFgColor(Color.RGB(30,144,255), 0);
setDefaultBarThickness(1, 9);
setDefaultBarStyle(PS_SOLID, 0);
setDefaultBarFgColor(Color.RGB(30,144,255), 0);
setDefaultBarThickness(1, 10);
setDefaultBarStyle(PS_SOLID, 0);
setDefaultBarFgColor(Color.RGB(30,144,255), 0);
setDefaultBarThickness(1, 11);
setDefaultBarStyle(PS_SOLID, 0);
setDefaultBarFgColor(Color.RGB(30,144,255), 0);
setDefaultBarThickness(1, 12);
setDefaultBarStyle(PS_SOLID, 0);
setDefaultBarFgColor(Color.RGB(30,144,255), 0);
setDefaultBarThickness(1, 13);
setDefaultBarStyle(PS_SOLID, 0);
setDefaultBarFgColor(Color.RGB(30,144,255), 0);
setDefaultBarThickness(1, 14);
setDefaultBarStyle(PS_SOLID, 0);
setDefaultBarFgColor(Color.RGB(30,144,255), 0);
setDefaultBarThickness(1, 15);
setDefaultBarStyle(PS_SOLID, 0);
setDefaultBarFgColor(Color.RGB(30,144,255), 0);
setDefaultBarThickness(1, 16);
setDefaultBarStyle(PS_SOLID, 0);
setDefaultBarFgColor(Color.RGB(30,144,255), 0);
setDefaultBarThickness(1, 17);
setDefaultBarStyle(PS_SOLID, 0);
setDefaultBarFgColor(Color.RGB(30,144,255), 0);
setDefaultBarThickness(1, 18);
setDefaultBarStyle(PS_SOLID, 0);
setDefaultBarFgColor(Color.RGB(30,144,255), 0);
setDefaultBarThickness(1, 19);
setDefaultBarStyle(PS_SOLID, 0);
setDefaultBarFgColor(Color.RGB(30,144,255), 0);
setDefaultBarThickness(1, 20);
}
// globals
var vOutputArray = null;
var vLastSeenDay = null;
var vInterval = null;
var vSymbol = null;
function main() {
// initialize upon first loading formula
if(getBarState() == BARSTATE_ALLBARS) {
vInterval = getInterval();
vSymbol = getSymbol().toUpperCase();
// for RTH, eg, to convert, ES Z2 to ES Z2=2
var rootSymbol = vSymbol.substring(0,3);
if (rootSymbol == "ES " || rootSymbol == "NQ ")
if ( vSymbol.indexOf("=2") == -1 )
vSymbol += "=2";
vSymbol += ",D";
return null;
}
// return null if not an intraday chart
if(vInterval == null || vInterval == "D" ||
vInterval == "W" || vInterval == "M" || vInterval == "T")
return null;
// if first bar in new day, get and save yesterday's data
var vThisday = null;
if (vLastSeenDay != (vThisDay = getDay()) ) {
var vTime = getValue("Time");
if(vTime != null) {
var vYDay = getPreviousTradingDay(vTime,vSymbol);
if(vYDay != null) {
var vIndex = getFirstBarIndexOfDay(vYDay,vSymbol);
if(vIndex != null) {
var ydayH = getValueAbsolute("High", vIndex,
vSymbol);
var ydayL = getValueAbsolute("Low", vIndex,
vSymbol);
var ydayC = getValueAbsolute("Close", vIndex,
vSymbol);
var yday8th = (ydayH - ydayL) / 8;
var yday3th = (ydayH - ydayL) / 3;
var yday0125 = ydayL - yday8th;
var yday025 = yday0125 - yday8th;
var yday033 = ydayL - yday3th;
var yday0375 = yday025 - yday8th;
var yday050 = yday0375 - yday8th;
var yday0625 = yday050 - yday8th;
var yday066 = yday033 - yday3th;
var yday075 = yday0625 - yday8th;
var yday0875 = yday075 - yday8th;
var yday100 = yday0875 - yday8th;
var yday125 = yday100 - yday8th;
var yday133 = yday100 - yday3th;
var yday1375 = yday125 - yday8th;
var yday150 = yday1375 - yday8th;
var yday1625 = yday150 - yday8th;
var yday175 = yday1625 - yday8th;
var yday166 = yday133 - yday3th;
var yday175 = yday1625 - yday8th;
var yday1875 = yday175 - yday8th;
var yday200 = yday1875 - yday8th;
var PrevL = ydayL
vOutputArray = new Array
(yday0125,yday025,yday033,yday0375,yday050,yday062 5,yday066,yday075,yday0875,
yday100,yday125,yday133,yday1375,yday150,yday1625, yday166,yday175,yday1875,
yday200,PrevL);
vLastSeenDay = vThisDay;
return vOutputArray;
}
}
return null;
}
}
// else just return the saved data
else
return vOutputArray;
}
1. plot only today extentions, that is, erase all lines in the past of the chart except today extentions.
2. being able to show/hide the extentions using some buttom in the chart, like some i saw in a murray math script.
3. if possible, this is just a luxuriouse issue, a way to show the extentions until 100% and only if buttom clicked show the full extentions until 200%.
I have two scrips, one for up extentions and another to down extentions, if button works with hide/show, it is possible to merge both efs and do a up/down buttoms?
Will apreciate all help.
Best Regards
Gil Araújo
Below the code
function preMain() {
setPriceStudy(true);
setStudyTitle("Range Expantions DONW");
setCursorLabelName("0.125", 0);
setCursorLabelName("0.250", 1);
setCursorLabelName("0.330", 2);
setCursorLabelName("0.375", 3);
setCursorLabelName("0.500", 4);
setCursorLabelName("0.625", 5);
setCursorLabelName("0.660", 6);
setCursorLabelName("0.750", 7);
setCursorLabelName("0.875", 8);
setCursorLabelName("1.000", 9);
setCursorLabelName("1.125", 10);
setCursorLabelName("1.250", 11);
setCursorLabelName("1.330", 12);
setCursorLabelName("1.375", 13);
setCursorLabelName("1.500", 14);
setCursorLabelName("1.625", 15);
setCursorLabelName("1.660", 16);
setCursorLabelName("1.750", 17);
setCursorLabelName("1.875", 18);
setCursorLabelName("2.000", 19);
setCursorLabelName("PrevL", 20);
//setComputeOnClose(true);
setDefaultBarStyle(PS_SOLID, 0);
setDefaultBarFgColor(Color.RGB(30,144,255), 0);
setDefaultBarThickness(1, 0);
setDefaultBarStyle(PS_SOLID, 0);
setDefaultBarFgColor(Color.RGB(30,144,255), 0);
setDefaultBarThickness(1, 1);
setDefaultBarStyle(PS_SOLID, 0);
setDefaultBarFgColor(Color.RGB(30,144,255), 0);
setDefaultBarThickness(1, 2);
setDefaultBarStyle(PS_SOLID, 0);
setDefaultBarFgColor(Color.RGB(30,144,255), 0);
setDefaultBarThickness(1, 3);
setDefaultBarStyle(PS_SOLID, 0);
setDefaultBarFgColor(Color.RGB(30,144,255), 0);
setDefaultBarThickness(1, 4);
setDefaultBarStyle(PS_SOLID, 0);
setDefaultBarFgColor(Color.RGB(30,144,255), 0);
setDefaultBarThickness(1, 5);
setDefaultBarStyle(PS_SOLID, 0);
setDefaultBarFgColor(Color.RGB(30,144,255), 0);
setDefaultBarThickness(1, 6);
setDefaultBarStyle(PS_SOLID, 0);
setDefaultBarFgColor(Color.RGB(30,144,255), 0);
setDefaultBarThickness(1, 7);
setDefaultBarStyle(PS_SOLID, 0);
setDefaultBarFgColor(Color.RGB(30,144,255), 0);
setDefaultBarThickness(1, 8);
setDefaultBarStyle(PS_SOLID, 0);
setDefaultBarFgColor(Color.RGB(30,144,255), 0);
setDefaultBarThickness(1, 9);
setDefaultBarStyle(PS_SOLID, 0);
setDefaultBarFgColor(Color.RGB(30,144,255), 0);
setDefaultBarThickness(1, 10);
setDefaultBarStyle(PS_SOLID, 0);
setDefaultBarFgColor(Color.RGB(30,144,255), 0);
setDefaultBarThickness(1, 11);
setDefaultBarStyle(PS_SOLID, 0);
setDefaultBarFgColor(Color.RGB(30,144,255), 0);
setDefaultBarThickness(1, 12);
setDefaultBarStyle(PS_SOLID, 0);
setDefaultBarFgColor(Color.RGB(30,144,255), 0);
setDefaultBarThickness(1, 13);
setDefaultBarStyle(PS_SOLID, 0);
setDefaultBarFgColor(Color.RGB(30,144,255), 0);
setDefaultBarThickness(1, 14);
setDefaultBarStyle(PS_SOLID, 0);
setDefaultBarFgColor(Color.RGB(30,144,255), 0);
setDefaultBarThickness(1, 15);
setDefaultBarStyle(PS_SOLID, 0);
setDefaultBarFgColor(Color.RGB(30,144,255), 0);
setDefaultBarThickness(1, 16);
setDefaultBarStyle(PS_SOLID, 0);
setDefaultBarFgColor(Color.RGB(30,144,255), 0);
setDefaultBarThickness(1, 17);
setDefaultBarStyle(PS_SOLID, 0);
setDefaultBarFgColor(Color.RGB(30,144,255), 0);
setDefaultBarThickness(1, 18);
setDefaultBarStyle(PS_SOLID, 0);
setDefaultBarFgColor(Color.RGB(30,144,255), 0);
setDefaultBarThickness(1, 19);
setDefaultBarStyle(PS_SOLID, 0);
setDefaultBarFgColor(Color.RGB(30,144,255), 0);
setDefaultBarThickness(1, 20);
}
// globals
var vOutputArray = null;
var vLastSeenDay = null;
var vInterval = null;
var vSymbol = null;
function main() {
// initialize upon first loading formula
if(getBarState() == BARSTATE_ALLBARS) {
vInterval = getInterval();
vSymbol = getSymbol().toUpperCase();
// for RTH, eg, to convert, ES Z2 to ES Z2=2
var rootSymbol = vSymbol.substring(0,3);
if (rootSymbol == "ES " || rootSymbol == "NQ ")
if ( vSymbol.indexOf("=2") == -1 )
vSymbol += "=2";
vSymbol += ",D";
return null;
}
// return null if not an intraday chart
if(vInterval == null || vInterval == "D" ||
vInterval == "W" || vInterval == "M" || vInterval == "T")
return null;
// if first bar in new day, get and save yesterday's data
var vThisday = null;
if (vLastSeenDay != (vThisDay = getDay()) ) {
var vTime = getValue("Time");
if(vTime != null) {
var vYDay = getPreviousTradingDay(vTime,vSymbol);
if(vYDay != null) {
var vIndex = getFirstBarIndexOfDay(vYDay,vSymbol);
if(vIndex != null) {
var ydayH = getValueAbsolute("High", vIndex,
vSymbol);
var ydayL = getValueAbsolute("Low", vIndex,
vSymbol);
var ydayC = getValueAbsolute("Close", vIndex,
vSymbol);
var yday8th = (ydayH - ydayL) / 8;
var yday3th = (ydayH - ydayL) / 3;
var yday0125 = ydayL - yday8th;
var yday025 = yday0125 - yday8th;
var yday033 = ydayL - yday3th;
var yday0375 = yday025 - yday8th;
var yday050 = yday0375 - yday8th;
var yday0625 = yday050 - yday8th;
var yday066 = yday033 - yday3th;
var yday075 = yday0625 - yday8th;
var yday0875 = yday075 - yday8th;
var yday100 = yday0875 - yday8th;
var yday125 = yday100 - yday8th;
var yday133 = yday100 - yday3th;
var yday1375 = yday125 - yday8th;
var yday150 = yday1375 - yday8th;
var yday1625 = yday150 - yday8th;
var yday175 = yday1625 - yday8th;
var yday166 = yday133 - yday3th;
var yday175 = yday1625 - yday8th;
var yday1875 = yday175 - yday8th;
var yday200 = yday1875 - yday8th;
var PrevL = ydayL
vOutputArray = new Array
(yday0125,yday025,yday033,yday0375,yday050,yday062 5,yday066,yday075,yday0875,
yday100,yday125,yday133,yday1375,yday150,yday1625, yday166,yday175,yday1875,
yday200,PrevL);
vLastSeenDay = vThisDay;
return vOutputArray;
}
}
return null;
}
}
// else just return the saved data
else
return vOutputArray;
}

Comment