 Tweet
Tweet
File Name: YieldCurve.efs
Description:
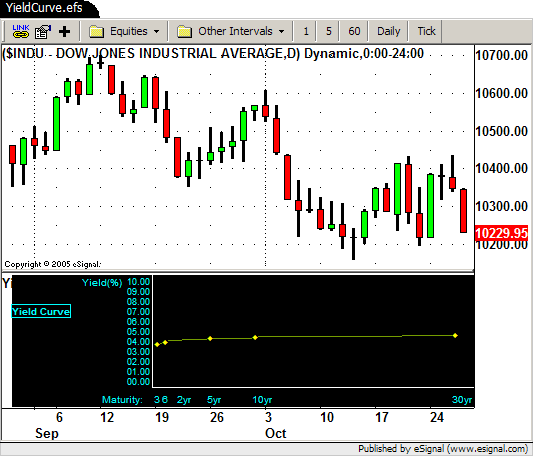
Plots the yield curve as a non-price study using the 3-month, 6-month, 5-year, 10-year and 30-year yields.
Formula Parameters:
Color: Text - cyan
Y-Axis Increment (Pixels) - 10
Color: Yield Points - yellow
Color: Yield Lines - yellow
Y-Axis Upper limit - 10
Notes:
Requires version 7.9 or higher.
Download File:
YieldCurve.efs
EFS Code:
Description:
Plots the yield curve as a non-price study using the 3-month, 6-month, 5-year, 10-year and 30-year yields.
Formula Parameters:
Color: Text - cyan
Y-Axis Increment (Pixels) - 10
Color: Yield Points - yellow
Color: Yield Lines - yellow
Y-Axis Upper limit - 10
Notes:
Requires version 7.9 or higher.
Download File:
YieldCurve.efs
EFS Code:
PHP Code:
/*********************************

Provided By:

    Interactive Data Corporation (Copyright c eSignal) 2010.

    All rights reserved. This sample eSignal Formula Script (EFS)

    is for educational purposes only. Interactive Data Corporation

    reserves the right to modify and overwrite this EFS file with

    each new release.


Description:

    Yield Curve


Version:            2.0  04/26/2010


Formula Parameters:                     Default:

    Color: Text                Cyan

    Color: Yield Points             Yellow

    Color: Yield Lines              Yellow

    Y-Axis Increment (Pixels)       10

    Y-Axis Upper limit              10


Notes:

   - GB symbols were changes with -PX in version 2.0


**********************************/


function preMain() {

    setStudyTitle("Yield Curve");

    setShowCursorLabel(false);

    setDefaultBarBgColor(Color.black);

    setShowTitleParameters(false);


    var fp1 = new FunctionParameter("TextFg", FunctionParameter.COLOR);

        fp1.setName("Color: Text");

        fp1.setDefault(Color.cyan);


    var fp2 = new FunctionParameter("Yinc", FunctionParameter.NUMBER);

        fp2.setName("Y-Axis Increment (Pixels)");

        fp2.setLowerLimit(1);

        fp2.setDefault(10);


    var fp3 = new FunctionParameter("cYieldDots", FunctionParameter.COLOR);

        fp3.setName("Color: Yield Points");

        fp3.setDefault(Color.yellow);


    var fp4 = new FunctionParameter("cYieldLines", FunctionParameter.COLOR);

        fp4.setName("Color: Yield Lines");

        fp4.setDefault(Color.yellow);


    var fp5 = new FunctionParameter("nYmax", FunctionParameter.NUMBER);

        fp5.setName("Y-Axis Upper limit");

        fp5.setLowerLimit(0);

        fp5.setDefault(10);

}


var aSym = new Array(6);

//note: 2YR bond - no access through EFS.

aSym[0] = "BIL M3-PX";  // 3 mo

aSym[1] = "BIL M6-PX";  // 6 mo

aSym[2] = "";           // 2 yr

aSym[3] = "$FVX";       // 5 yr

aSym[4] = "$TNX";       // 10yr

aSym[5] = "$TYX";       // 30yr


var aMaturities = new Array(6);

aMaturities[0] = new Array(2);

aMaturities[1] = new Array(2);

aMaturities[2] = new Array(2);

aMaturities[3] = new Array(2);

aMaturities[4] = new Array(2);

aMaturities[5] = new Array(2);

aMaturities[0][0] = "3";

aMaturities[1][0] = "6";

aMaturities[2][0] = "2yr";

aMaturities[3][0] = "5yr";

aMaturities[4][0] = "10yr";

aMaturities[5][0] = "30yr";

aMaturities[0][1] = 2;

aMaturities[1][1] = 10;

aMaturities[2][1] = 25;

aMaturities[3][1] = 55;

aMaturities[4][1] = 100;

aMaturities[5][1] = 300;


var cTextFg = Color.cyan;

var cTextBg = Color.black;

var g_cYieldDots = null;

var g_cYieldLines = null;

var nYieldPos = null;

var nYieldPos1 = null;


// pixel increments for x and y scale

var nY = 10;  // 1.00 yeild increment = 10 pixels

var nX = 1;  // space in pixels between x-axis labels (1 mo = 1 pixel)


var bInit = false;


function main(Yinc, TextFg, cYieldDots, cYieldLines, nYmax) {

    var nState = getBarState();


    if (getCurrentBarIndex() < -1) return;


    if (bInit == false) {

        cTextFg = TextFg;

        g_cYieldDots = cYieldDots;

        g_cYieldLines = cYieldLines;

        //g_nLineThick = nLineThick;

        nY = Yinc;

        bInit = true;

    }


    if (nState == BARSTATE_NEWBAR) {

        // draw x y axis

        drawTextPixel(150, 20, "t", Color.white, Color.white,

            Text.RELATIVETOLEFT|Text.RELATIVETOBOTTOM|Text.BOTTOM,

            null, 10, "x-axis", 1, 999);

        drawTextPixel(150, 20, "t", Color.white, Color.white,

            Text.RELATIVETOLEFT|Text.RELATIVETOBOTTOM|Text.LEFT,

            null, 10, "y-axis", 999, 1);


        // draw x and y axis labels

        drawTextPixel(10, 30, "Yield Curve", cTextFg, cTextBg,

            Text.LEFT|Text.RELATIVETOTOP|Text.RELATIVETOLEFT|Text.BOLD|Text.FRAME,

            null, 10, "title");

        drawTextPixel(80, 1, "Yield(\%)", cTextFg, cTextBg,

            Text.LEFT|Text.RELATIVETOTOP|Text.RELATIVETOLEFT,

            null, 10, "xLabel");

        drawTextPixel(100, 2, "Maturity:", cTextFg, cTextBg,

            Text.LEFT|Text.RELATIVETOBOTTOM|Text.RELATIVETOLEFT,

            null, 10, "yLabel");

        // draw x axis scale labels

        var i = 0;

        for (i = 0; i < 6; i++) {

            if (i != 2) {

                nYmax = Math.max(nYmax, close(0, aSym[i]));

            }

        }

        nYmax = Math.round(nYmax);

        i = 0;

        while (i <= (nY*nYmax)) {

            var txt = (i/nY);

            if (Math.round(txt) < 10) txt = "0" + txt.toFixed(2);

            else txt = txt.toFixed(2);

            drawTextPixel(125, 20+(i), txt, cTextFg, cTextBg,

                Text.RELATIVETOLEFT|Text.RELATIVETOBOTTOM,

                null, 9, "x-axis"+i);

                i += (nY);

        }


        // draw y axis maturity labels and yields

        i = 0;

        for (i = 0; i < 6; i++) {

            // maturity labels

            drawTextPixel(150+(aMaturities[i][1]), 2, aMaturities[i][0], cTextFg, cTextBg,

                Text.RELATIVETOLEFT|Text.RELATIVETOBOTTOM|Text.BOTTOM,

                null, 10, "y-axis"+i);

            // yields

            if (i != 2) {

                nYieldPos1 = nYieldPos;

                nYieldPos = getY(i);

                if (i > 0) drawYieldLine(nYieldPos, nYieldPos1, i);

                drawTextPixel(150+(aMaturities[i][1]), nYieldPos+2, "u", cYieldDots, cTextBg,

                    Text.RELATIVETOLEFT|Text.RELATIVETOBOTTOM,

                    "Wingdings", 5, "yield"+i);

            }

        }

    }


    return;

}


function getY(i) {

    var n = close(0, sym(aSym[i]));

    return (20 + (n*nY));

}


function drawYieldLine(x, x1, i) {

    var nRise = x - x1;

    var j = i - 1;

    if (i == 3) j--;

    var nRun = 150 + (aMaturities[i][1] - aMaturities[j][1]);

    var nSlope = nRise/nRun;


    var start = 150 + aMaturities[j][1] +5;

    var end = 150 + aMaturities[i][1]-0;

    for (var cntr = start; cntr < end; cntr++) {

        drawTextPixel(cntr, x1+(cntr*nSlope), "'", g_cYieldLines, cTextBg,

            Text.RELATIVETOLEFT|Text.RELATIVETOBOTTOM|Text.TOP,

            null, 5, "yieldLine"+cntr+"_"+i);

    }


    return;

}