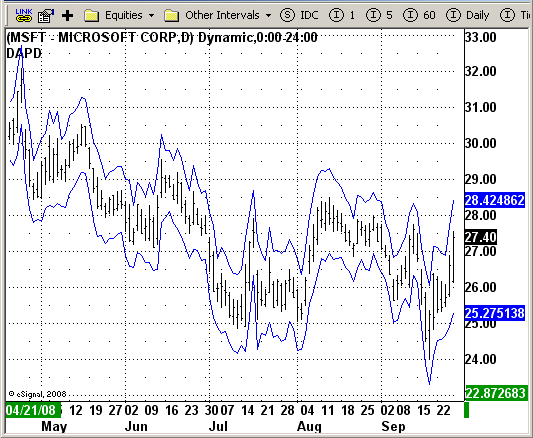
File Name: DAPD.efs
Description:
DAPD - Daily Average Price Delta.
Formula Parameters:
Length: 21
Notes:
This indicator is similar to Bollinger Bands. It based on DAPD - Daily
Average Price Delta. DAPD is based upon a summation for each of the
highs (hod) for the 21 days prior to today minus the summation for
each of the lows (lod) for the last 21 days prior to today. The result
of this calculation would then be divided by 21.
Download File:
DAPD.efs

EFS Code:
Description:
DAPD - Daily Average Price Delta.
Formula Parameters:
Length: 21
Notes:
This indicator is similar to Bollinger Bands. It based on DAPD - Daily
Average Price Delta. DAPD is based upon a summation for each of the
highs (hod) for the 21 days prior to today minus the summation for
each of the lows (lod) for the last 21 days prior to today. The result
of this calculation would then be divided by 21.
Download File:
DAPD.efs

EFS Code:
PHP Code:
/*********************************

Provided By:

    eSignal (Copyright c eSignal), a division of Interactive Data

    Corporation. 2008. All rights reserved. This sample eSignal

    Formula Script (EFS) is for educational purposes only and may be

    modified and saved under a new file name.  eSignal is not responsible

    for the functionality once modified.  eSignal reserves the right

    to modify and overwrite this EFS file with each new release.


Description:

   DAPD - Daily Average Price Delta.


Version:            1.0  09/26/2008


Notes:

    This indicator is similar to Bollinger Bands. It based on DAPD - Daily

    Average Price Delta. DAPD is based upon a summation for each of the

    highs (hod) for the 21 days prior to today minus the summation for

    each of the lows (lod) for the last 21 days prior to today. The result

    of this calculation would then be divided by 21.


Formula Parameters:                     Default:

    Length                             21


**********************************/


var fpArray = new Array();

var bInit = false;


function preMain()

{

    setStudyTitle("DAPD");

    setCursorLabelName("Top DAPD", 0);

    setCursorLabelName("Bottom DAPD", 1);

    setDefaultBarFgColor(Color.blue, 0);

    setDefaultBarFgColor(Color.blue, 1);


    setPlotType(PLOTTYPE_LINE, 0);

    setPlotType(PLOTTYPE_LINE, 1);


    setDefaultBarThickness(1, 0);

    setDefaultBarThickness(1, 1);


    setPriceStudy(true);


    var x=0;

    fpArray[x] = new FunctionParameter("Length", FunctionParameter.NUMBER);

    with(fpArray[x++]){

        setLowerLimit(1);

        setDefault(21);

    }


}


var xHighSMA = null;

var xLowSMA = null;


function main(Length) {

var nState = getBarState();

var nDAPD = 0;


    if (nState == BARSTATE_ALLBARS) {

        if (Length == null) Length = 21;

    }


    if ( bInit == false ) {

        xHighSMA = sma(Length, high());

        xLowSMA = sma(Length, low());

        bInit = true;

    }


    if (getCurrentBarCount() < Length)     return;


    nDAPD = xHighSMA.getValue(0) - xLowSMA.getValue(0);


    return new Array(high(0) + nDAPD, low(0) - nDAPD);

}