 Tweet
Tweet
File Name: ITL.efs
Description:
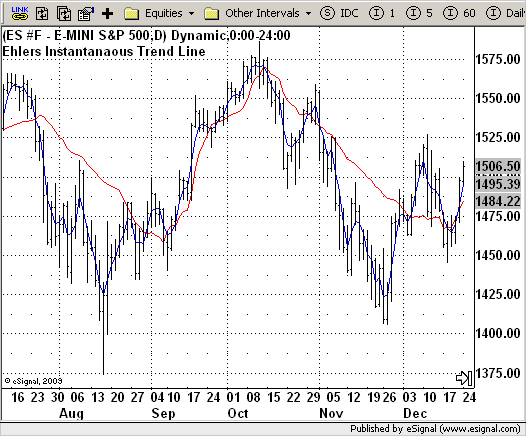
Instantaneous Trend Line (J. Ehler)
Formula Parameters:
Notes:
The early identification of a trend then depends on a valid
measurement of short-term cyclic activity. There are two ways
to do so, either by cycle elimination or by spectrum analysis.
Of the two, cycle elimination is by far the easier.
The identification of the trend is that easy. One can eliminate
the cyclic component when use the average over the cycle length.
One could adjust the average as the cycle length varies and plot
the results day-by-day. The author called the result an "instantaneous
trendline".
You can read more about this approach in Early Trend Identification
by John F. Ehlers article published in 10/1990 Stocks&Commodities magazine.
Download File:
ITL.efs
EFS Code:
Description:
Instantaneous Trend Line (J. Ehler)
Formula Parameters:
Notes:
The early identification of a trend then depends on a valid
measurement of short-term cyclic activity. There are two ways
to do so, either by cycle elimination or by spectrum analysis.
Of the two, cycle elimination is by far the easier.
The identification of the trend is that easy. One can eliminate
the cyclic component when use the average over the cycle length.
One could adjust the average as the cycle length varies and plot
the results day-by-day. The author called the result an "instantaneous
trendline".
You can read more about this approach in Early Trend Identification
by John F. Ehlers article published in 10/1990 Stocks&Commodities magazine.
Download File:
ITL.efs
EFS Code:
PHP Code:
/*********************************

Provided By:

    eSignal (Copyright c eSignal), a division of Interactive Data

    Corporation. 2009. All rights reserved. This sample eSignal

    Formula Script (EFS) is for educational purposes only and may be

    modified and saved under a new file name.  eSignal is not responsible

    for the functionality once modified.  eSignal reserves the right

    to modify and overwrite this EFS file with each new release.


Description:

    Instantaneous Trend Line (J. Ehler)


Version:            1.0  05/18/2009


Formula Parameters:                     Default:


Notes:

    The early identification of a trend then depends on a valid

    measurement of short-term cyclic activity. There are two ways

    to do so, either by cycle elimination or by spectrum analysis.

    Of the two, cycle elimination is by far the easier.

    The identification of the trend is that easy. One can eliminate

    the cyclic component when use the average over the cycle length.

    One could adjust the average as the cycle length varies and plot

    the results day-by-day. The author called the result an "instantaneous

    trendline".

    You can read more about this approach in Early Trend Identification

    by John F. Ehlers article published in 10/1990 Stocks&Commodities magazine.

**********************************/

var bInit = false;


function preMain() {

    setPriceStudy(true);

    setStudyTitle("Ehlers Instantanaous Trend Line");

    setCursorLabelName("TR",0);

    setDefaultBarFgColor(Color.red,0);

    setCursorLabelName("ZL",1);

    setDefaultBarFgColor(Color.blue,1);

}


var xValue1 = null;

var xInPhase = null;

var xQuadrature = null;

var xPhase = null;

var xDeltaPhase = null;

var xInstPeriod = null;

var xTrendline = null;


function main(){

var Trendline = 0;

var    value11 = 0;

    if (bInit == false) {

        xValue1 = mom(6);

        xInPhase = ema(6, xValue1);

        xQuadrature = ema(10, efsInternal("Calc_Value3", xValue1));

        xPhase = efsInternal("Calc_Phase", xInPhase, xQuadrature);

        xDeltaPhase = efsInternal("Calc_DeltaPhase", xPhase);

        xInstPeriod = ema(8, efsInternal("Calc_InstPeriod", xDeltaPhase));

        xTrendline = efsInternal("Calc_Trendline", xInstPeriod);

        xvalue11 = ema(6, efsInternal("Calc_value11"));

        bInit = true;

    }

    Trendline = xTrendline.getValue(0);

    value11 = xvalue11.getValue(0);

    if (value11 == null || Trendline == null) return;

    return new Array(Trendline, value11);

}


function Calc_Value3(xValue1) {

var nRes = 0;

    nRes = 0.75 * (xValue1.getValue(0) - xValue1.getValue(-6)) + 0.25 * (xValue1.getValue(-2) - xValue1.getValue(-4));

    return nRes;

}


function Calc_Phase(xInPhase, xQuadrature) {

var Phase = 0;

var    InPhase = xInPhase.getValue(0);

var    Quadrature = xQuadrature.getValue(0)

var    InPhase_1 = xInPhase.getValue(-1);

var    Quadrature_1 = xQuadrature.getValue(-1)

        if(Math.abs(InPhase + InPhase_1) > 0)

            Phase = Math.atan(Math.abs( (Quadrature + Quadrature_1) / (InPhase + InPhase_1) ));

        if(InPhase < 0 && Quadrature > 0)

            Phase = 180 - Phase;

           if(InPhase < 0 && Quadrature < 0)

               Phase = 180 + Phase;

           if(InPhase > 0 && Quadrature < 0)

               Phase = 360 - Phase;

    return Phase;

}


function Calc_DeltaPhase(xPhase) {

var DeltaPhase = 0;

var Phase = xPhase.getValue(0);

var Phase_1 =  xPhase.getValue(-1);

           DeltaPhase = Phase_1 - Phase;

           if(Phase_1 < 90 && Phase > 270)

               DeltaPhase = 360 + Phase_1 - Phase;

           if(DeltaPhase < 1)

               DeltaPhase = 1;

           if(DeltaPhase > 60)

               Deltaphase = 60;

    return DeltaPhase;

}


function Calc_InstPeriod(xDeltaPhase) {

var    InstPeriod = 0;

var InstPeriod_1 = ref(-1);

var    value4 = 0;

var i = 0;

    if (xDeltaPhase.getValue(-40) == null) return;

    for(i = 0; i <= 40; i++){

        value4 += xDeltaPhase.getValue(-i);

        if(value4 > 360 && InstPeriod == 0)

            InstPeriod = i;

    }

    if(InstPeriod == 0)

        InstPeriod = InstPeriod_1;

    return InstPeriod;

}


var xClose = null;


function Calc_Trendline(xInstPeriod) {

var value5 = xInstPeriod.getValue(0);

var tmp = 0;

var Period = 0;

var Trendline = 0;

    if (xClose == null) xClose = close();

    if (value5 == null) return;

    if(value5 < 0){

        tmp = - value5;

        Period = - Math.floor(tmp);

    } else

        Period = Math.floor(value5);


    Trendline = 0;

    for(i = Period + 1; i >= 0; i--)

        Trendline += xClose.getValue(-i);

    if(Period > 0)

        Trendline = Trendline / (Period + 2);

    return Trendline;

}


var bSecondInit = false;

var xSecMom = null;


function Calc_value11() {

var value11 = 0;

    if (bSecondInit == false) {

        xSecMom = mom(3);

    }

    value11 = close(0) + 0.5 * xSecMom.getValue(0);

    return value11;

}