 Tweet
Tweet
File Name: RVI.efs
Description:
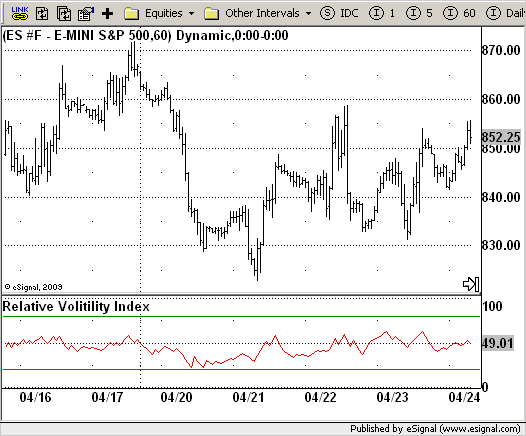
Relative Volatility Index (RVI)
Formula Parameters:
Period : 10
UpperBand : 80
LowerBand : 20
Notes:
The RVI is a modified form of the relative strength index (RSI).
The original RSI calculation separates one-day net changes into
positive closes and negative closes, then smoothes the data and
normalizes the ratio on a scale of zero to 100 as the basis for the
formula. The RVI uses the same basic formula but substitutes the
10-day standard deviation of the closing prices for either the up
close or the down close. The goal is to create an indicator that
measures the general direction of volatility. The volatility is
being measured by the 10-days standard deviation of the closing prices.
Download File:
RVI.efs
EFS Code:
Description:
Relative Volatility Index (RVI)
Formula Parameters:
Period : 10
UpperBand : 80
LowerBand : 20
Notes:
The RVI is a modified form of the relative strength index (RSI).
The original RSI calculation separates one-day net changes into
positive closes and negative closes, then smoothes the data and
normalizes the ratio on a scale of zero to 100 as the basis for the
formula. The RVI uses the same basic formula but substitutes the
10-day standard deviation of the closing prices for either the up
close or the down close. The goal is to create an indicator that
measures the general direction of volatility. The volatility is
being measured by the 10-days standard deviation of the closing prices.
Download File:
RVI.efs
EFS Code:
PHP Code:
/*********************************

Provided By:

    eSignal (Copyright c eSignal), a division of Interactive Data

    Corporation. 2009. All rights reserved. This sample eSignal

    Formula Script (EFS) is for educational purposes only and may be

    modified and saved under a new file name.  eSignal is not responsible

    for the functionality once modified.  eSignal reserves the right

    to modify and overwrite this EFS file with each new release.


Description:

    Relative Volatility Index


Version:            1.0  05/21/2009


Formula Parameters:                     Default:

    Period                              10

    UpperBand                           80

    LowerBand                           20


Notes:

    The RVI is a modified form of the relative strength index (RSI).

    The original RSI calculation separates one-day net changes into

    positive closes and negative closes, then smoothes the data and

    normalizes the ratio on a scale of zero to 100 as the basis for the

    formula. The RVI uses the same basic formula but substitutes the

    10-day standard deviation of the closing prices for either the up

    close or the down close. The goal is to create an indicator that

    measures the general direction of volatility. The volatility is

    being measured by the 10-days standard deviation of the closing prices.

**********************************/

var fpArray = new Array();

var bInit = false;


function preMain() {

    setStudyTitle("Relative Volitility Index");

    setCursorLabelName("RVI",0);

    setDefaultBarFgColor(Color.red,0);

    setStudyMin(-1);

    setStudyMax(101);

    var x = 0;

    fpArray[x] = new FunctionParameter("Period", FunctionParameter.NUMBER);

    with(fpArray[x++]) {

        setLowerLimit(1);

        setDefault(10);

    }

    fpArray[x] = new FunctionParameter("UpperBand", FunctionParameter.NUMBER);

    with(fpArray[x++]) {

        setName("Upper Band");

        setLowerLimit(1);

        setDefault(80);

    }

    fpArray[x] = new FunctionParameter("LowerBand", FunctionParameter.NUMBER);

    with(fpArray[x++]) {

        setName("Lower Band");

        setLowerLimit(1);

        setDefault(20);

    }

}


var xRVI = null;


function main(Period, UpperBand, LowerBand) {

var nBarState = getBarState();

var nRVI = 0;

    if (nBarState == BARSTATE_ALLBARS) {

        if(Period == null) Period = 10;

    }

    if (bInit == false) {

        addBand(LowerBand, PS_SOLID, 1, Color.red, "Lower Band");

        addBand(UpperBand, PS_SOLID, 1, Color.green, "Upper Band");

        xRVI = efsInternal("Calc_RVI", Period);

        bInit = true;

    }

    nRVI = xRVI.getValue(0);

    if (nRVI == null) return;

    return nRVI;

}


var bSecondInit = false;

var xStdDev = null;

var xClose = null;

var nU1 = 0;

var nD1 = 0;

var nU = 0;

var nD = 0;


function Calc_RVI(nPeriod) {

var nRes = 0;

var u = 0;

var d = 0;

    if (bSecondInit == false) {

        xClose = close();

        xStdDev = efsInternal("Calc_StdDev", nPeriod, sma(nPeriod), xClose);

        bSecondInit = true;

    }

    if (xStdDev.getValue(0) == null) return;

    if (getBarState() == BARSTATE_NEWBAR){

        nU1 = nU;

        nD1 = nD;

    }

    if(xClose.getValue(0) > xClose.getValue(-1)) {

        u = xStdDev.getValue(0);

        d = 0;

    } else {

        d = xStdDev.getValue(0);

        u = 0;

    }

    nU = (13 * nU1 + u) / 14;

    nD = (13 * nD1 + d) / 14;

    nRes = 100 * nU / (nU + nD);

    return nRes;

}


function Calc_StdDev(nPeriod, xMA, xClose) {

var StdDev = 0;

var SumSqr = 0;

var counter = 0;

    if(xMA.getValue(0) == null) return;

    for(counter = 0; counter < nPeriod; counter++)

        SumSqr += Math.pow((xClose.getValue(-counter) - xMA.getValue(0)), 2);

    StdDev = Math.sqrt(SumSqr / nPeriod);

    return StdDev;

}