 Tweet
Tweet
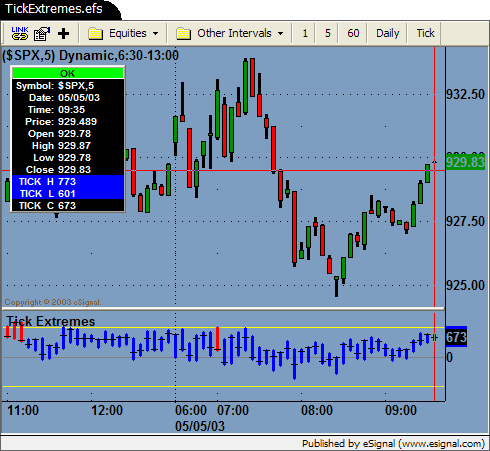
File Name: TickExtremes.efs
Description:
Non-price study of $TICK draws HLC information and colors the bar red as the $TICK High or Low exceeds the upper or lower extreme parameters.
Formula Parameters:
nTickHigh: Default is 1000
nTickLow: Default is –1000
nNumBars: Default is 150
Notes:
The formula uses drawLineRelative() to create the bars and is set to only draw 150 bars of historical data. The larger the number of bars drawn with this function the slower the chart responds when scrolling back to view the history. The number can be increased as necessary through the “Edit Studies” option but try not to use too large a number for performance reasons.
Download File:
TickExtremes.efs
EFS Code:
PHP Code:
/*********************************

Provided By : eSignal. (c) Copyright 2003

*********************************/


function preMain() {

    setStudyTitle(" Tick Extremes ");

    setCursorLabelName("TICK  H", 0);

    setCursorLabelName("TICK  L", 1);

    setCursorLabelName("TICK  C", 2);

    setPlotType(PLOTTYPE_DOT, 0);

    setPlotType(PLOTTYPE_DOT, 1);

    setPlotType(PLOTTYPE_FLATLINES, 2);

    setDefaultBarThickness(1, 0);

    setDefaultBarThickness(1, 1);

    setDefaultBarThickness(1, 2);

    setDefaultBarFgColor(Color.blue, 0);

    setDefaultBarFgColor(Color.blue, 1);

    setDefaultBarFgColor(Color.black, 2);

    setStudyMax(1500);

    setStudyMin(-1500);

}


var vColor = Color.blue;

var vLoaded = false;

var barH = null;

var barL = null;

var vNum = 150;

var BarCntr = 0;


function main(nTickHigh, nTickLow, nNumOfBars) {

    if (nTickHigh == null) nTickHigh = 1000;

    if (nTickLow == null) nTickLow = -1000;

    if (vLoaded == false) {

        if (nNumOfBars != null) vNum = Math.abs(Math.round(nNumOfBars));

        addBand(nTickHigh, PS_SOLID, 1, Color.yellow, "top");

        addBand(0, PS_SOLID, 1, Color.grey, "zero");

        addBand(nTickLow, PS_SOLID, 1, Color.yellow, "bottom");

        vLoaded = true;

    }


    var c = close(0, 1, "$tick")*1;

    if (c == null) return;


    if (getBarState() == BARSTATE_NEWBAR) {

        if (BarCntr < vNum) {

            BarCntr += 1;

        } else {

            BarCntr = 0;

        }

        vColor = Color.blue;

        barH = c;

        barL = c;

    }


    var h = high(0, 1, "$tick")*1;

    if (h == null) return;

    var l = low(0, 1, "$tick")*1;

    if (l == null) return;


    barH = Math.max(barH, h, c);

    barL = Math.min(barL, l, c);


    if (barH > nTickHigh) {

        vColor = Color.red;

    }

    if (barL < nTickLow) {

        vColor = Color.red;

    }


    setBarFgColor(vColor, 0);

    setBarFgColor(vColor, 1);


    drawLineRelative(0, barL, 0, barH, PS_SOLID, 3, vColor, "bar" + BarCntr);


    return new Array(barH, barL, c);

}