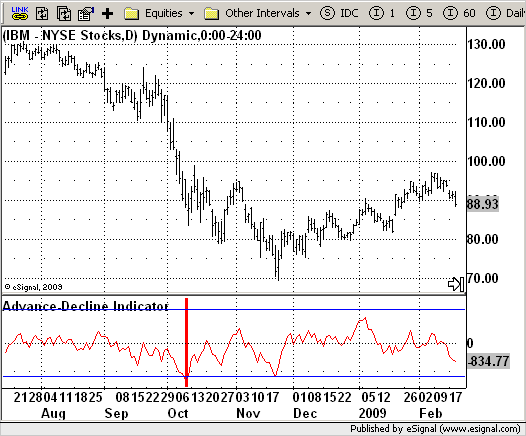
Description:
Advance-Decline Indicator
Formula Parameters:
Length : 10
BuyBand : -1500
SellBand : 1500
Symbol : $ADD
Notes:
The Advance-Decline Indicator is a market breadth indicator
based on the smoothed difference between advancing and declining issues.
The indicator shows when the stock market is overbought (and a correction
is due) and when it is oversold (and a rally is due).
The Advance-Decline Indicator is a 10-period exponential moving average of
the difference between the number of advancing and declining issues:
Download File:
AdvDecAvg.efs

EFS Code:
PHP Code:
/*********************************

Provided By:

    eSignal (Copyright c eSignal), a division of Interactive Data

    Corporation. 2009. All rights reserved. This sample eSignal

    Formula Script (EFS) is for educational purposes only and may be

    modified and saved under a new file name.  eSignal is not responsible

    for the functionality once modified.  eSignal reserves the right

    to modify and overwrite this EFS file with each new release.


Description:

    Advance-Decline Indicator


Version:            1.0  04/22/2009


Formula Parameters:                     Default:

    Length                              10

    BuyBand                             -1500

    SellBand                            1500

    Symbol                              $ADD


Notes:

    The Advance-Decline Indicator is a market breadth indicator

    based on the smoothed difference between advancing and declining issues.

    The indicator shows when the stock market is overbought (and a correction

    is due) and when it is oversold (and a rally is due).

    The Advance-Decline Indicator is a 10-period exponential moving average of

    the difference between the number of advancing and declining issues:


**********************************/

var fpArray = new Array();

var bInit = false;


function preMain() {

    setStudyTitle("Advance-Decline Indicator");

    setCursorLabelName("Advance-Decline", 0);

    setDefaultBarFgColor(Color.red, 0);

    setPriceStudy(false);

    setStudyMax(2000);

    setStudyMin(-2000);

    var x = 0;

    fpArray[x] = new FunctionParameter("Length", FunctionParameter.NUMBER);

    with(fpArray[x++]) {

        setLowerLimit(1);

        setDefault(10);

    }

    fpArray[x] = new FunctionParameter("BuyBand", FunctionParameter.NUMBER);

    with(fpArray[x++]) {

        setLowerLimit(-2000);

        setDefault(-1500);

    }

    fpArray[x] = new FunctionParameter("SellBand", FunctionParameter.NUMBER);

    with(fpArray[x++]) {

        setLowerLimit(-2000);

        setDefault(1500);

    }

    fpArray[x] = new FunctionParameter("Symbol", FunctionParameter.STRING);

    with(fpArray[x++]) {

        addOption("$ADDQ");

        addOption("$ADD");

        setDefault("$ADD");

    }

}


var xOvbOvs = null;


function main(Length, Symbol, BuyBand, SellBand) {

var nBarState = getBarState();

var nOvbOvs = 0;

    if (nBarState == BARSTATE_ALLBARS) {

        if (Length == null) Length = 10;

        if (BuyBand == null) BuyBand = -1500;

        if (SellBand == null) SellBand = 1500;

        if (Symbol == null) Symbol = "$ADD";

    }

    if (bInit == false) {

        addBand(BuyBand, PS_SOLID, 1, Color.blue, "Buy");

        addBand(SellBand, PS_SOLID, 1, Color.blue, "Sell");

        xOvbOvs = ema(Length, sym(Symbol));

        bInit = true;

    }

    nOvbOvs = xOvbOvs.getValue(0);

    if (nOvbOvs == null) return;

    if (nOvbOvs > SellBand) {

        setBarBgColor(Color.green);

    }

    if (nOvbOvs < BuyBand) {

        setBarBgColor(Color.red);

    }


    return nOvbOvs;

}