File Name: PriceAndStoch.efs
Description:
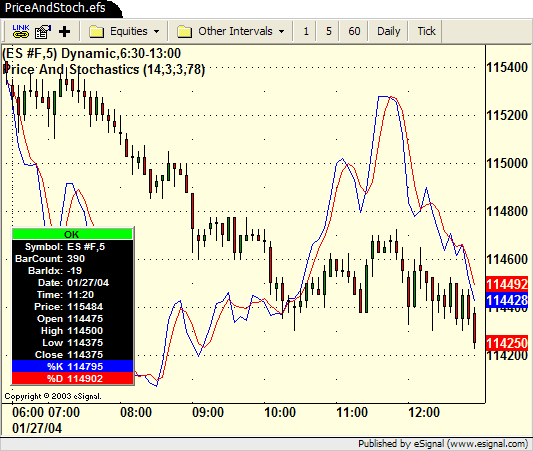
This formula converts the Stochastic outputs to the price scale of the chart to create an overlay of the Stochastic where the study shares the same y-axis as price. This creates a fixed, or scaled, relationship between the price and the Stochastic study.
Formula Parameters:
%K Length: 14
%K Smoothing: 1
%D Length: 3
Length for Scaling: 50
Notes:
The “Length for Scaling” parameter determines the conversion factor for the Stochastic outputs. The basic rule of thumb here is to enter a number equal to the number of visible bars in your chart.
Download File:
PriceAndStoch.efs

EFS Code:
Description:
This formula converts the Stochastic outputs to the price scale of the chart to create an overlay of the Stochastic where the study shares the same y-axis as price. This creates a fixed, or scaled, relationship between the price and the Stochastic study.
Formula Parameters:
%K Length: 14
%K Smoothing: 1
%D Length: 3
Length for Scaling: 50
Notes:
The “Length for Scaling” parameter determines the conversion factor for the Stochastic outputs. The basic rule of thumb here is to enter a number equal to the number of visible bars in your chart.
Download File:
PriceAndStoch.efs

EFS Code:
PHP Code:
/*********************************

Provided By : eSignal. (c) Copyright 2003

*********************************/


function preMain() {

    setPriceStudy(true);

    setStudyTitle("Price And Stochastics ");

    setCursorLabelName("%K", 0);

    setCursorLabelName("%D", 1);


    setDefaultBarThickness(1, 0);

    setDefaultBarThickness(1, 1);


    setDefaultBarFgColor(Color.blue, 0);

    setDefaultBarFgColor(Color.red, 1);


    var fp1 = new FunctionParameter("nKlength", FunctionParameter.NUMBER);

    fp1.setName("%K Length");

    fp1.setLowerLimit(1);

    fp1.setDefault(14);


    var fp2 = new FunctionParameter("nKsmooth", FunctionParameter.NUMBER);

    fp2.setName("%K Smoothing");

    fp2.setLowerLimit(1);

    fp2.setDefault(1);


    var fp3 = new FunctionParameter("nDlength", FunctionParameter.NUMBER);

    fp3.setName("%D Length");

    fp3.setLowerLimit(1);

    fp3.setDefault(3);


    var fp4 = new FunctionParameter("nScaleLength", FunctionParameter.NUMBER);

    fp4.setName("Length for Scaling");

    fp4.setLowerLimit(1);

    fp4.setDefault(50);

}


var aHighs = null;

var aLows = null;


var study = null;

var vHH = null;

var vLL = null;


function main(nKlength, nKsmooth, nDlength, nScaleLength) {

    var nState = getBarState();

    var vK = null;

    var vD = null;


    if (study == null) {

        study = new StochStudy(nKlength, nKsmooth, nDlength);

        aHighs = new Array(nScaleLength);

        aLows = new Array(nScaleLength);

    }


    if (nState == BARSTATE_NEWBAR) {

        aHighs.pop();

        aLows.pop();

        aHighs.unshift(high());

        aLows.unshift(low());

    } else {

        aHighs[0] = high();

        aLows[0] = low();

    }


    if (aHighs[nScaleLength-1] == null) return; // arrays are not filled yet


    vK = study.getValue(StochStudy.FAST);

    vD = study.getValue(StochStudy.SLOW);

    if (vK == null || vD == null) return;


    //define price scale from Highest High and Lowest Low from the last nScaleLength bars.

    vHH = high();

    vLL = low();

    for (i = 0; i < nScaleLength; ++i) {

        vHH = Math.max(vHH, aHighs[i]);

        vLL = Math.min(vLL, aLows[i]);

    }


    /*** convert stochastics to price scale (rsy equation:

        old stock value * ((price scale max - price scale min) / 100) + price scale min

    ************/

    vK = ( vK * (( vHH - vLL )/100) ) + vLL;

    vD = ( vD * (( vHH - vLL )/100) ) + vLL;


    return new Array(vK, vD);

}